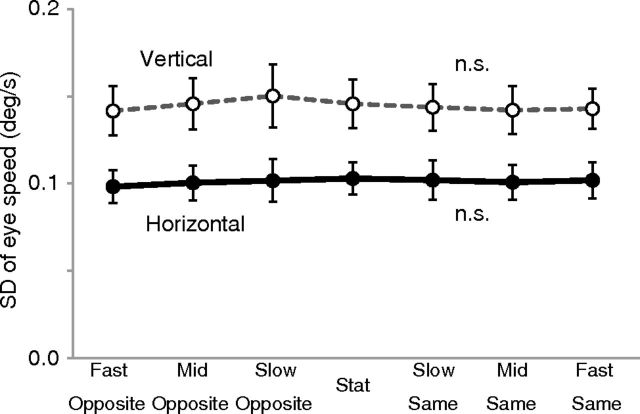
Figure 8.
Results of eye-movement recording (n = 9). Vertical axis represents the variability in eye speeds (SD of the Gaussian fitted to the histogram of instantaneous velocities during fixation). The black solid curve with black circles indicates horizontal speed, and the gray dotted curve with white circles indicates vertical speed. Error bars indicate ±1 SEM.

