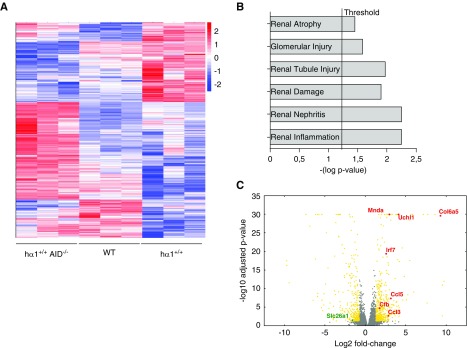
Figure 5.
hα1+/+ and hα1+/+AID−/− mice present differential glomerular gene expression. (A) Heatmap of differentially expressed genes in wild-type (WT), hα1+/+, and hα1+/+AID−/− mice (n=3 mice per condition) on the basis of Z score. Red indicates upregulated genes; blue indicates downregulated genes. (B) Top six nephrotoxicity parameters upregulated in hα1+/+AID−/− compared with hα1+/+ mice. (C) Volcano plot for transcriptome profiling data presenting mRNA log2 fold changes in hα1+/+AID−/− versus hα1+/+ mice. Some significant upregulated and downregulated genes are depicted.

