Figure 3.
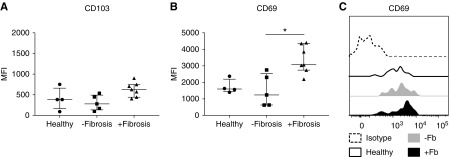
MAIT cells in diseased biopsy samples with interstitial fibrosis display a more activated phenotype. (A and B) Surface expression of (A) CD103 and (B) CD69 on MAIT cells in healthy kidney tissue and diseased biopsy samples without and with fibrosis. Values of median fluorescence intensity (MFI) for individual donors are shown; horizontal bars represent medians, with interquartile range also presented. *P<0.05, Kruskal–Wallis test with Dunn’s post-test. (C) Representative histogram of CD69 expression on MAIT cells from healthy kidney tissue (black unfilled) and diseased biopsy samples without (gray filled) and with (black filled) interstitial fibrosis compared with isotype (dashed).

