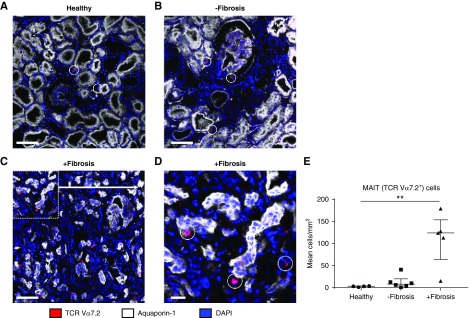
Figure 5.
Colocalization of human MAIT cells with PTECs in fibrotic kidney tissue suggests complex pathogenic interactions between the cell populations. (A–D) IF staining of frozen sections from (A) healthy kidney tissue, (B) nonfibrotic diseased kidney tissue, and (C and D) fibrotic diseased kidney tissue stained for TCR Vα7.2 (red), Aquaporin-1 (white), and DAPI (blue). MAIT cells are circled. Scale bars represent (A–C) 100 μm and (D) 20 μm. (E) Quantification of MAIT cells from healthy kidney tissue (n=4), nonfibrotic kidney biopsy samples (n=6), and fibrotic kidney biopsy samples (n=5). Values for individual donors are presented; horizontal bars represent medians, with interquartile range also presented. **P<0.01, Kruskal–Wallis test with Dunn’s post-test.

