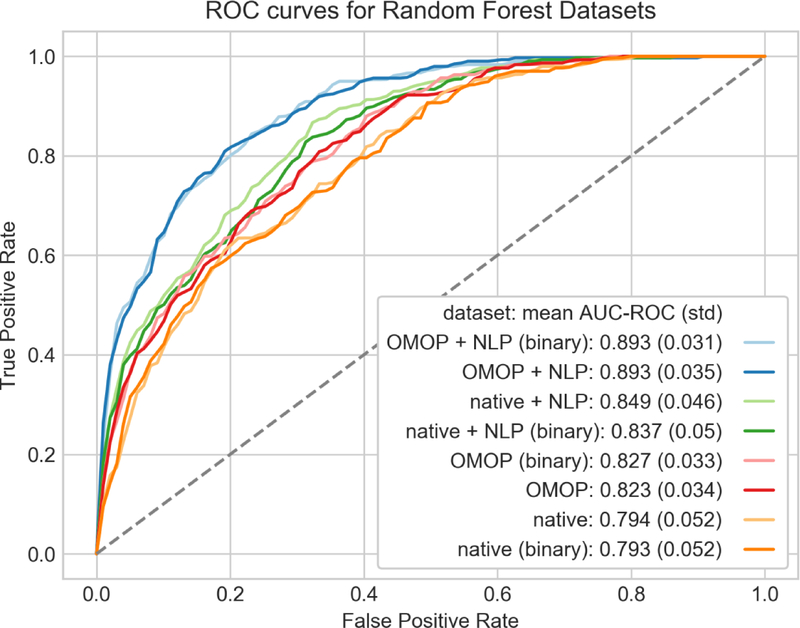
Fig. 6.
ROC curves of random forest models using combinations of features and feature representation. Each curve was generated using 10 fold-cross validation with micro-averaging across the four severity classes. Feature representations (binary or counts) are paired by color and ordered from lowest to highest mean AUC in the legend.

