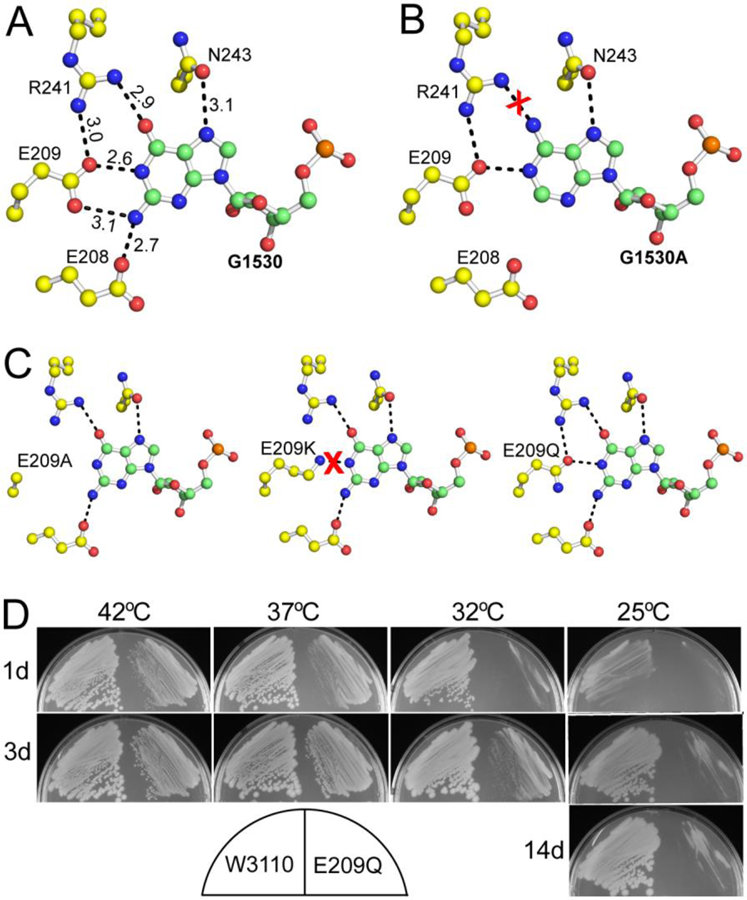
Figure 6.

The recognition of G1530 by Era. (A) Details of Era-G1530 recognition. G1530 and the side chains of E208, E209, R241, and N243 are illustrated as ball-and-stick models in atomic colors (C in green or yellow, O in red, N in blue, and P in orange). Dashed lines in black indicate hydrogen bonds and their distances are in Å. (B) Model of the G1530A mutant, suggesting that the mutant is not favorable for the recognition by Era due to the loss of two hydrogen bonds (between E208/E209 and the Gua base, panel A) and the creation of a repulsive interaction (between R241 and the Ade base, indicated with a red cross). (C) Models of the E209A, E209K, and E209Q mutants. Indicated is the impact of each mutation on the pseudo-base paring interaction between the G1530 base and the side chains of residues 209 and 241. (D) The E209Q mutant of Era is cold sensitive. Compared with the wild type (W3110, on the left of each sub-panel), the E209Q mutant (on the right of each sub-panel) grows slower at all temperatures tested. Growth impairment is observed at 37 and 42°C. At 32°C, small colonies appear after three days (3d). At 25°C, however, colonies do not appear even after 14 days (14d). This figure was originally published in Reference [13].
