
Figure 1. Global downregulation of ISG expression by CR6 infection in the intestine.
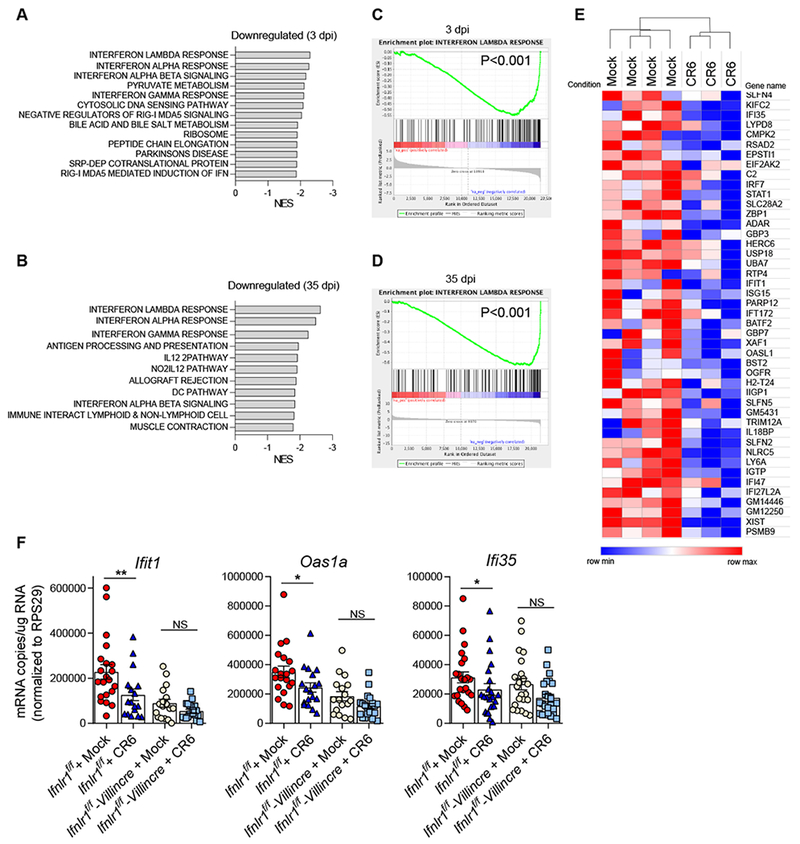
Wild-type mice were infected with 106 plaque forming units (PFU) of CR6 perorally. At 3 dpi and 35 dpi, ileum from the infected mice and the littermate control mice were collected for mRNA sequencing. (A-D) Host gene expression profile was analyzed by GSEA. Net-enrichment-scores (NES) of negatively affected gene-sets by CR6-infection at 3 dpi (A) and 35 dpi (B). Enrichment plots of Interferon lambda response genes at 3 dpi (C) and 35 dpi (D). (E) A heat-map showing downregulation of ISGs by CR6 infection at 35 dpi. (F) Ifnlr1f/f and Ifnlr1f/f-Villincre mice were infected with 106 PFU of CR6, and the expression of Ifit1, Oas1a and Ifi35 mRNA in ileum was analyzed at 35 dpi by qRT-PCR (n = 22-24 mice per group, combined from five independent experiments). Shown are means ± SEM. NS, not significant; *P < 0.05, **P < 0.01, determined by unpaired t-test. See also Figure S1.