
Figure 6. NS1-immunization prevents MNoV infection in vivo.
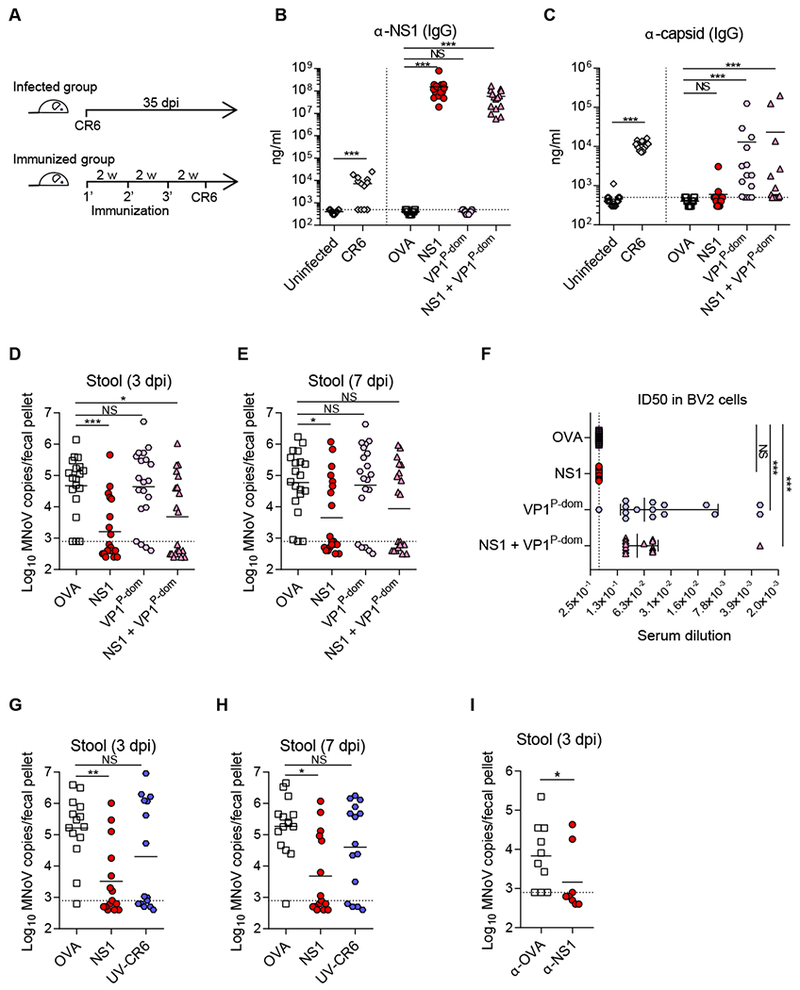
(A) Schematic outline of infection and immunization. (B-C) Concentration of α-NSI IgG (B) and α-capsid IgG (C) in the serum was measured by ELISA, and normalized by monoclonal antibodies CM79 and A6.2 respectively. (D-E) NS1-vaccination protected the mice from CR6-infection. MNoV genome from stool was quantified by qRT-PCR at 3 dpi (D) and 7 dpi (E). (F) VP1P-dom immune-sera protect CR6-infection in BV2 cells. ID50 values for protection were determined by serial dilution of the immune-sera from 1:10 to 1:100,000. (G-H) Vaccination of NS1 or UV-CR6. MNoV genome from stool was quantified by qRT-PCR at 3 dpi (G) and 7 dpi (H). (I) Passive serum transfer protected the mice from CR6 infection. Serum from the immunized mice with OVA or NS1 was transferred to naïve mice 1 week prior to CR6 infection. MNoV genome from stool was quantified by qRT-PCR at 3 dpi. (B, C, F) n = 14-15 per group, combined from three independent experiments. (D-E) n = 19-20 per group, combined from four independent experiments. (G-H) n = 10 per group, combined from two independent experiments. (I) n = 9-10 per group, combined from two independent experiments. Shown are means ± SEM. NS, not significant; *P < 0.05; **P < 0.01; ***P < 0.001, determined by Mann-Whitney test (B-C infected group, I) or Kruskal-Wallis test (B-C immunized group, D-H). See also Figure S4 and Figure S5.