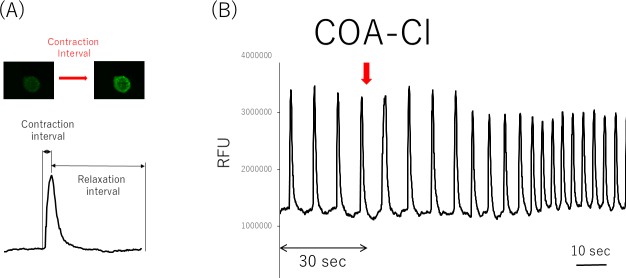
Fig 5. The contraction of pure hiPSC-CM spheroids was visualized using Fluo-4 (a calcium indicator).
Pure hiPSC-CM spheroids were then loaded with Fluo-4, which fluoresces upon calcium binding. Representative still images of resting and contracting pure hiPSC-CM spheroids, taken from a time-lapse video capturing the calcium influx during contraction. Rate-interval graph demonstrating spheroid contraction as measured by recording the changes in the Fluo-4 fluorescence intensity. The contraction interval was determined as the time between low Fluo-4 fluorescence (relaxed cells) and high Fluo-4 fluorescence intensity (contracted spheroids) (A). COA-Cl increased the beating rate of pure hiPSC-CM spheroids in the early phase. The medium was loading buffer. Pure hiPSC-CM spheroids were assessed to determine their ability to contract using a Fluo-4 calcium binding assay. The rate interval graph shows fluctuations in the Fluo-4 fluorescence intensity, indicative of pure hiPSC-CMs spheroid contraction, under basal conditions for 30 s and after sequential treatment with COA-Cl. COA-Cl affected the rate of contraction at an early stage. The contraction rate of differentiated pure hiPSC-CM spheroids was determined as the number of contractions (contraction interval + relaxation interval) per minute. The data were from nine individual experiments, each of which was performed three times (B).

