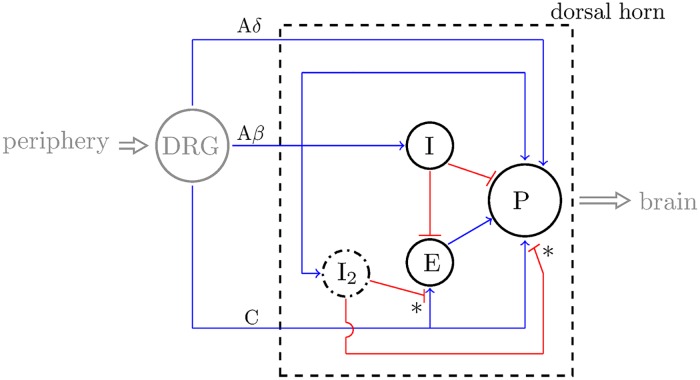
Fig 1. Diagram of our model of the dorsal horn (DH) circuit (within the dashed rectangle) including connections between the neuron populations I, E, and P, the afferent fibers Aβ, Aδ, and C, and the dorsal root ganglion (DRG).
We denote inhibitory connections with bars (in red) and excitatory connections with arrows (in blue). The dash-dotted line represents an inhibitory interneuron population (I2) that is modeled indirectly.

