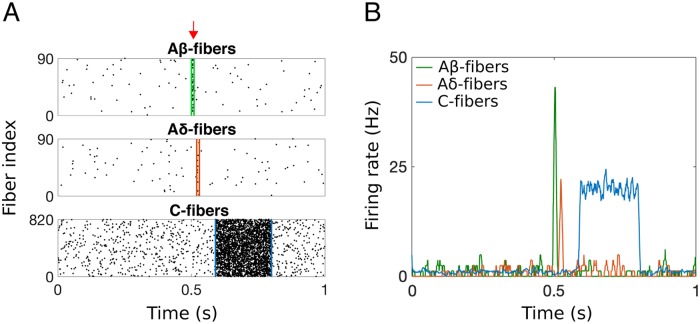
Fig 3. Simulated response of the populations of afferent nerve fibers to a brief nociceptive stimulus at t = 0.5 s (red arrow).
A: Raster plots of spiking activity of (top) 90 Aβ-, (middle) 90 Aδ-, and (bottom) 820 C-fibers with differing conductance speeds. B: The smoothed instantaneous firing rate (i.e., fAβ(t), fAδ(t), and fC(t)) for each fiber population.

