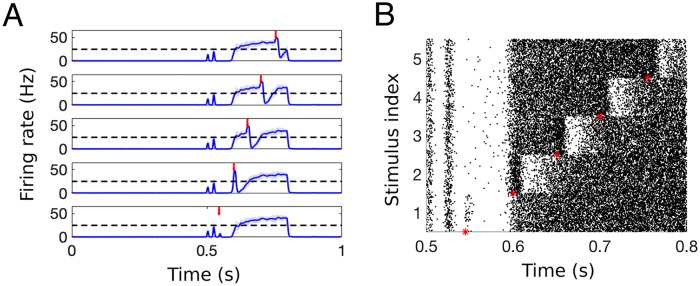
Fig 9. Inhibition of painful response by subsequent activation of Aβ-fiber activity.
A: Firing rate of the projection neurons in response to secondary Aβ stimulation following brief nociceptive stimulus activating all three fibers. B: Spike raster plot generated from the model output shown in A for 1000 PNs constructed to resemble Fig 5 in [21], which replicates experiments from [47]. We denote the arrival of the second Aβ-pulse with a red tick mark (asterisk) in A (B).

