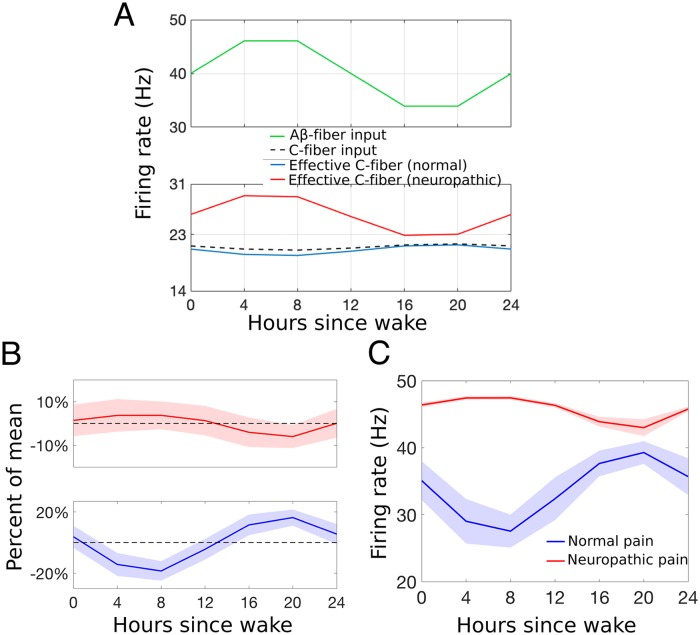
Fig 11. A change in the daily rhythms of pain sensitivity in neuropathic pain conditions compared to normal conditions.
A: Daily variation of the stimulus response firing rates of the Aβ- (top panel) and C-fibers (lower panel, dashed curve), and effective C-fiber stimulus response firing rate including effects of Aβ-dependent presynaptic inhibition under normal conditions (lower panel, blue curve, same as in Fig 4B) and Aβ-dependent presynaptic excitation under neuropathic (red curve) conditions. B, C: Daily variation in the response of the PNs to a brief nociceptive stimulus quantified by the percent of its mean (B) and average firing rate of the C-fiber response (C) for normal (blue, same as in Fig 5) and neuropathic (red) conditions. The x-axis refers to hours since the typical or scheduled morning wake time.

