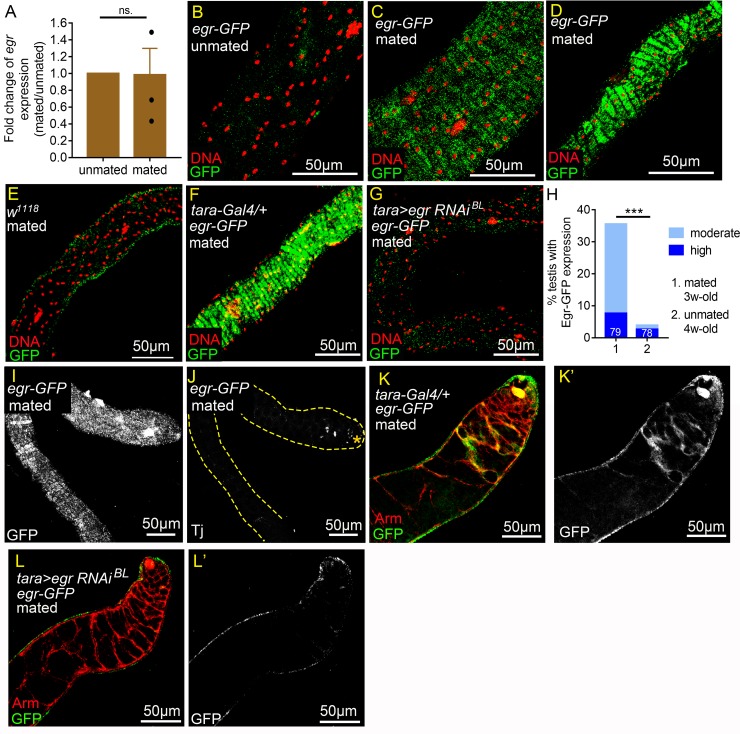
Fig 8. Reproduction triggers Egr accumulation in the testis smooth muscles.
(A) qRT-PCR analysis of egr levels in testes from 3w-old males. Error bars represent SEM. N (The number of independent biological replicates) = 3. egr levels in testes were comparable between unmated and mated males. (B-G) Optical sections of the testicular muscle layer. All testes were immunostained for GFP (green), co-stained for DNA (red). (B-D) Testes from 3w-old egr-GFP males. (B) There were no specific anti-GFP signals detected in the muscles of unmated testes (30 vs. 0). (C and D) Egr-GFP was detected in moderate (C) or high (D) levels in the muscles of testes from males in the mass-mating scheme. (E) There were no specific anti-GFP signals in the testicular muscles of mated 3w-old w1118 males (10 vs. 20). (F and G) Testes from mated 4w-old males (10 vs. 20). Anti-GFP signals were completely abolished in tara>egr RNAi testes (G), while high levels of Egr-GFP was still observed in the tara-Gal/+ control testis (F). (H) Percentages of testes with Egr-GFP accumulation in the muscles. Testes were from mated 3w-old males (1 vs. 6) or 4w-old single males kept in solitude (unmated, 1vs. 0). N = number of testes scored. (I and J) Confocal optical sections of a single testis from mated 3w-old egr-GFP male (1 vs. 6) immunostained for GFP, co-stained for Tj. Sections of testis surface and testis interior are shown in (I) and (J), respectively. While Egr-GFP accumulated in high levels in the muscles as early as week 3 (I), cyst cell differentiation was not yet disrupted, as shown by apically restricted Tj expression (J). Hub is marked by the asterisk. (K-L’) Testes from mated 3w-old egr-GFP males (10 vs. 20) immunostained with GFP (Green), co-stained with Arm (red). Egr-GFP was detected in some of the cyst cells (K and K’). Anti-GFP signals in cyst cells were abolished by depletion of egr in muscles by tara-Gal4 (L and L’). P-value was calculated with paired t test in A and Chi-squared test for H. ns.: p>0.05 and ***p<0.001.

