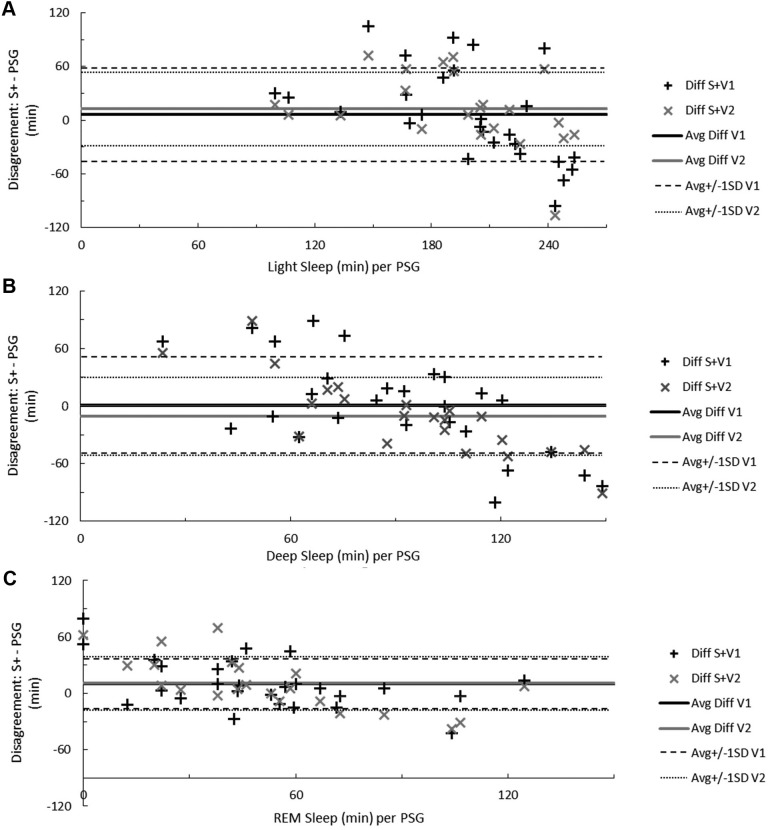
Figure 3. Sleep staging disagreement between measurements.
Bland-Altman concordance between the S+ device and PSG when recognizing both stage N1 and N2 sleep as light sleep (A), stage N3 sleep as deep sleep (B), and REM sleep (C). Solid lines indicate average discrepancy, dashed and dotted lines indicate ± 1 standard deviation, and symbols correspond to the number of minutes differing for each participant. On the ordinate, a positive difference indicates overestimation and a negative difference underestimation relative to PSG. The range of participant light, deep, or REM sleep time in minutes, according to RPSGT-scored PSG, is on the abscissa. Avg = average, Diff = difference, PSG = polysomnography, S+V1 = algorithm version 1, S+V2 = algorithm version 2, SD = standard deviation.

