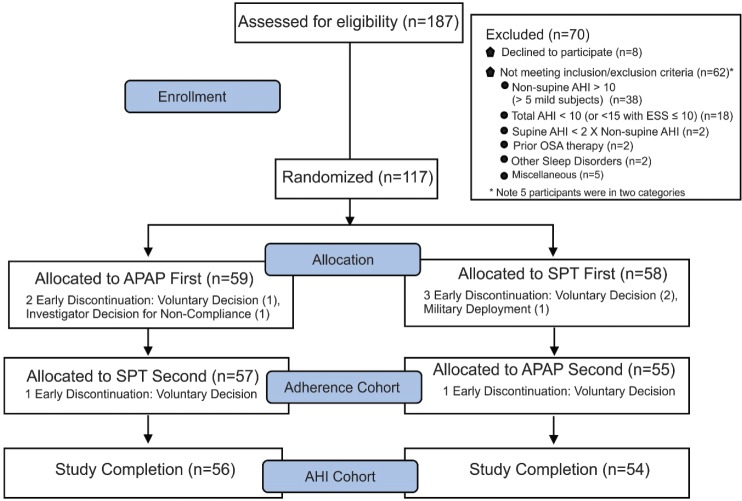
Figure 1. Flow chart.
A flow chart showing the number of participants at each step of the study as well as the adherence and AHI primary endpoint cohorts. AHI = apnea-hypopnea index, APAP = auto-adjusting positive airway pressure, ESS = Epworth Sleepiness Scale, OSA = obstructive sleep apnea, SPT = sleep position treatment.

