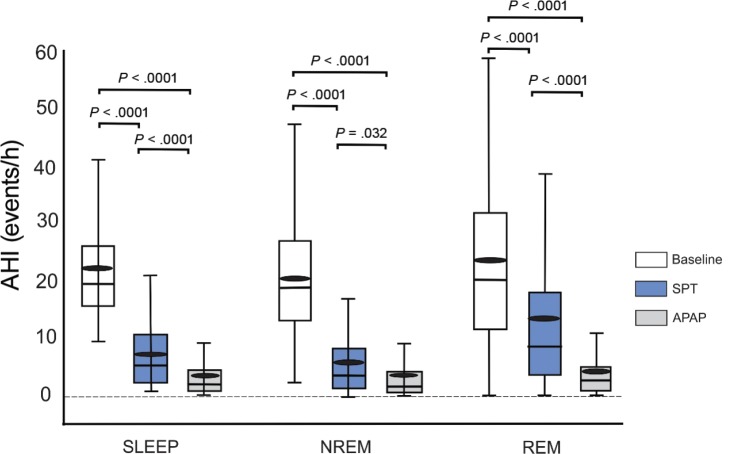
Figure 2. Baseline and treatment AHI values for sleep, NREM sleep and REM sleep.
The box plot shows AHI values—median (horizontal line), interquartile range (rectangle), and the range of values excluding outlier values (whiskers) at baseline and on SPT and APAP treatment. The small black ellipses are the means. For sleep, NREM sleep, and REM sleep both treatments were significantly lower than baseline. The AHI for APAP was also lower than for SPT. The mean (SPT-APAP) AHI difference for participants was 3.58 events/h. However, the upper bound of the one sided 95% confidence interval of the mean difference was 4.96 events/h and within the prestudy noninferiority difference hypothesis of 5 events/h. AHI = apnea-hypopnea index, APAP = auto-adjusting positive airway pressure, NREM = non-rapid eye movement, REM = rapid eye movement, SPT = sleep position treatment.

