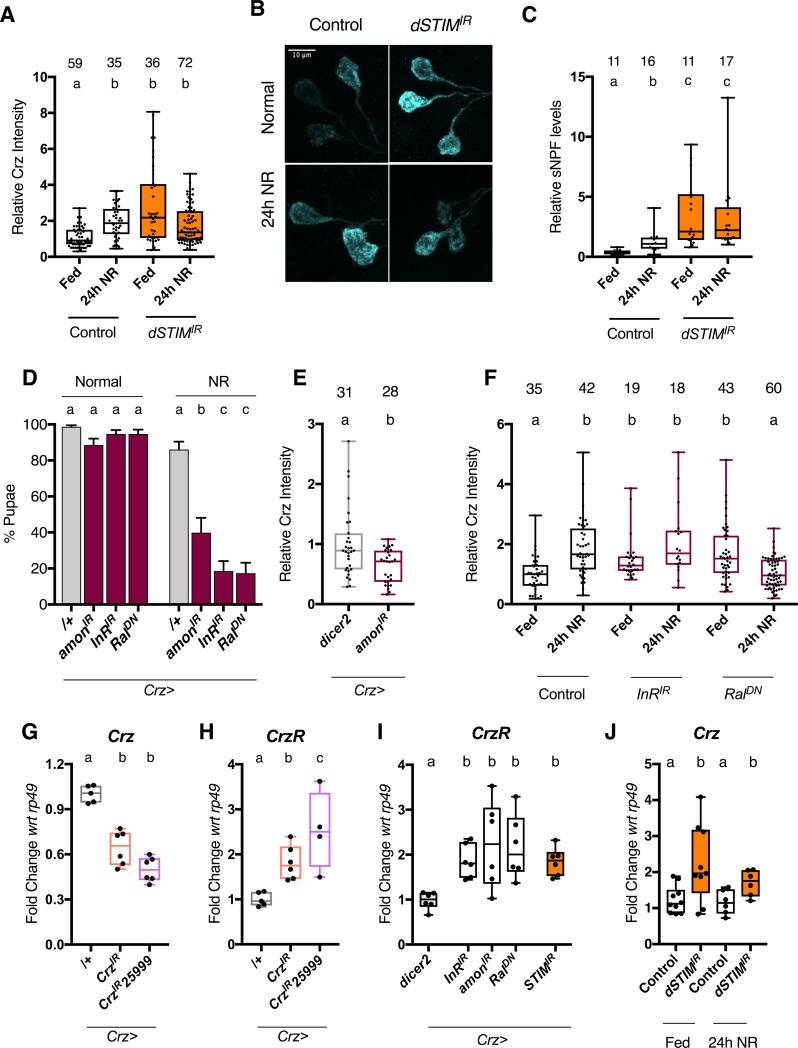
Fig 3. dSTIM regulates Crz and sNPF levels.
Larvae were subjected to 24 hours of normal (fed) or nutrient restricted (NR) media. Crz levels were measured in DLP neurons by immunofluorescence on larval brains. All manipulations were performed using the Crz-GAL4 driver (A) Relative levels of Crz peptide in DLP neuron cell bodies, Control = crz>dicer2. dSTIMIR = crz> dSTIMIR,dicer2. Number of cells measured shown atop bars. N>12 brains (B) Representative images for cell bodies measured in (A). (C) Relative levels of total sNPF peptides measured on dissected ring glands (N atop bars) and quantified using MALDI-MS. Externally added heavy standard (Hug-PK*) was used to normalise peptide levels between samples. (D) % Pupae on normal or NR media, upon reduced peptide processing (amonIR,dicer2) protein synthesis (Insulin receptor; InRIR) or vesicle exocytosis (dominant-negative Ral; RalDN) in Crz+ neurons. Data represents mean ± SEM (E) Relative levels of Crz upon expression of amonIR and dicer2. N>10 brains. (F) Relative levels of Crz upon indicated cellular perturbation of Crz+ neurons. N≥6 brains. control: Crz-GAL4/+. (G) Crz mRNA levels from larval brains when Crz is reduced by two different RNAi lines. N ≥ 5. (H) Corazonin receptor (CrzR) mRNA levels from larval brains with reduced Crz. N ≥ 4. (I) CrzR mRNA levels from larval brains expressing indicated cellular perturbations in Crz neurons. N ≥ 6 (J) Crz mRNA levels from larval brains. Control = crz>dicer2. dSTIMIR = crz> dSTIMIR,dicer2 N ≥ 6. Bars with the same alphabet represent statistically indistinguishable groups. Kruskal-Wallis Test with Dunn’s multicomparison correction p<0.05 for (A), (C), (F). Mann-Whitney Test for (E). Two-way ANOVA with Sidak’s multi comparison test p<0.05 for (D), (J). One-way ANOVA with Tukey multi comparison test p<0.05 for (G), (H), (I). See also S3 Fig and for source data, S3 Table.

