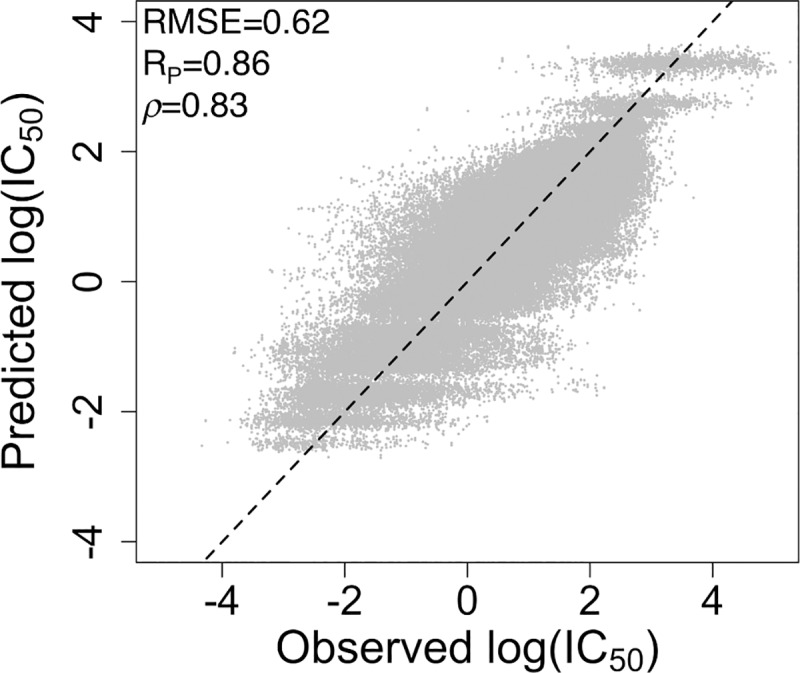
Fig 4. IC50 values for all combinations of drugs and cancer cell lines in the GDSC data set as predicted by random forest regression models.

Predictions of log(IC50) were achieved using 5-fold cross-validation. Performance statistics are calculated for the test sets. The RMSE, Pearson correlation (RP), Spearman rank correlation (ρ), and corresponding regression line are shown.
