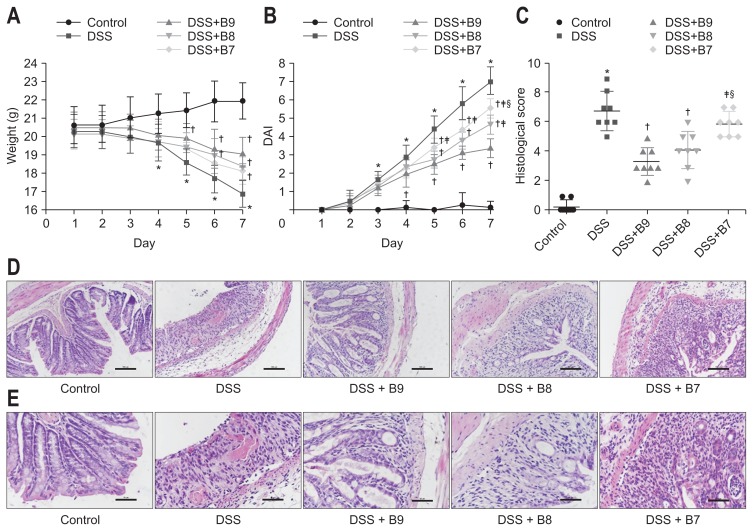
Fig. 1.
(A) Effect of Bifidobacterium infantis on weight. (B) Disease activity index (DAI) changes among groups. Values given as the mean±SD (*p<0.01, compared to the control group; †p<0.05, compared to the dextran sodium sulfate [DSS] group; ‡p<0.05, compared to the DSS+B9 group; §p<0.05, compared to the DSS+B8 group). (C) Colonic damage scores. Values given as the mean±SD (*p<0.01, compared to the control group; †p<0.01, compared to the DSS group; ‡p<0.01, compared to the DSS+B9 group; §p<0.05, compared to the DSS+B8 group). (D) Representative H&E-stained colon sections are shown (original magnification, ×200). Control group: normal crypt architecture and absence of inflammation; DSS group: mucosal structure was damaged, extensive crypts were destroyed, and large numbers of infiltrating inflammatory cells; DSS+B9 group: mild inflammation involved the mucosal layer, and the crypt damage was less than 1/3; DSS+B8 group: mild inflammation involved the submucosa, and the crypt damage was between 1/3 and 2/3; DSS+B7 group: mild inflammation involved the muscle layer, and the crypt damage was 2/3. (E) Histopathology of the colon, representative H&E-stained colon sections (original magnification, ×400).

