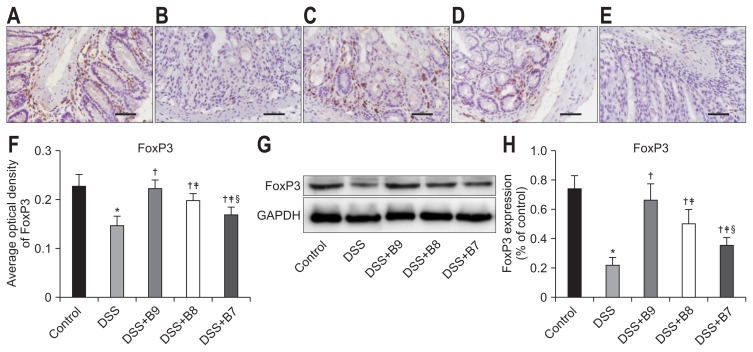
Fig. 2.
Effects of Bifidobacterium infantis on Foxp3. (A–E) Foxp3 was detected by immunohistochemistry in the control, dextran sodium sulfate (DSS), DSS+B9, DSS+B8, and DSS+B7 groups (original magnification, ×400). (F) Analysis of Foxp3 expression by average optical density according to (A–E). (G) Foxp3 expression in each group by Western blot. (H) Analysis of Foxp3 according to (G). Values given as the mean±SD (*p<0.01, compared to the control group; †p<0.05, compared to the DSS group; ‡p<0.05, compared to the DSS+B9 group; §p<0.05, compared to the DSS+B8 group).

