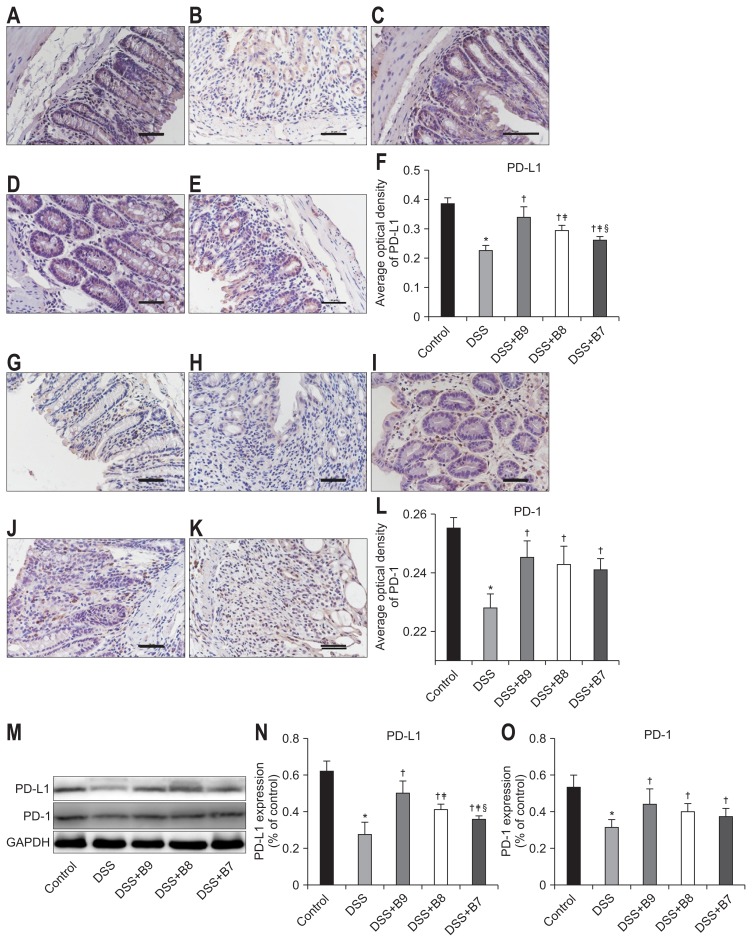
Fig. 4.
Effects of Bifidobacterium infantis on PD-L1 and PD-1. (A–E) PD-L1 and (G–K) PD-1 were detected by immunohistochemistry in the control, dextran sodium sulfate (DSS), DSS+B9, DSS+B8, and DSS+B7 groups (original magnification, ×400). (F, L) Analysis of the expression of PD-L1 and PD-1 by average optical density according to (A–E) and (G–K). (M) Expression of PD-L1 and PD-1 in each group by Western blot. (N, O) Analysis of IL-10 and TGF-β1 according to (M). Values given as the mean±SD (*p<0.01, compared to the control group; †p<0.05, compared to the DSS group; ‡p<0.05, compared to the DSS+B9 group; §p<0.05, compared to the DSS+B8 group).
PD-L1, programmed cell death ligand 1; PD-1, programmed cell death 1.

