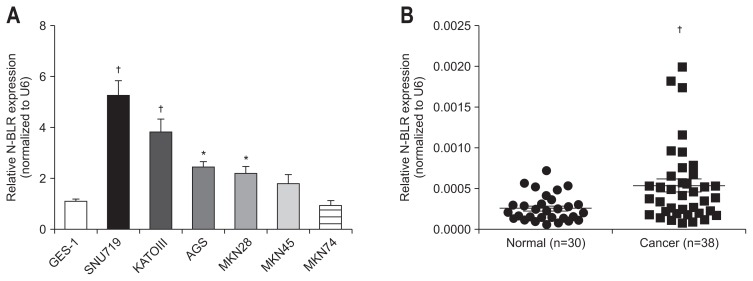
Fig. 1.
N-BLR was overexpressed in gastric cell lines and tissues. (A) The relative expression of N-BLR was upregulated in gastric cancer cells including SNU719, KATOIII, AGS, MKN28, MKN45, and MKN74, compared to GES-1, a normal gastric cell line. (B) N-BLR expression was estimated in gastric cancer tissues (n=38) and paired adjacent noncancerous tissues (n=30). The expression of N-BLR was calculated by the 2–ΔΔCt method using U6 levels for normalization. These data represent the mean±SEM. *p<0.05 and †p<0.01 show a statistically significant difference compared with a scrambled control. N-BLR was not detected in eight adjacent noncancerous tissue samples by quantitative real-time reverse transcription polymerase chain reaction (qRT-PCR).

