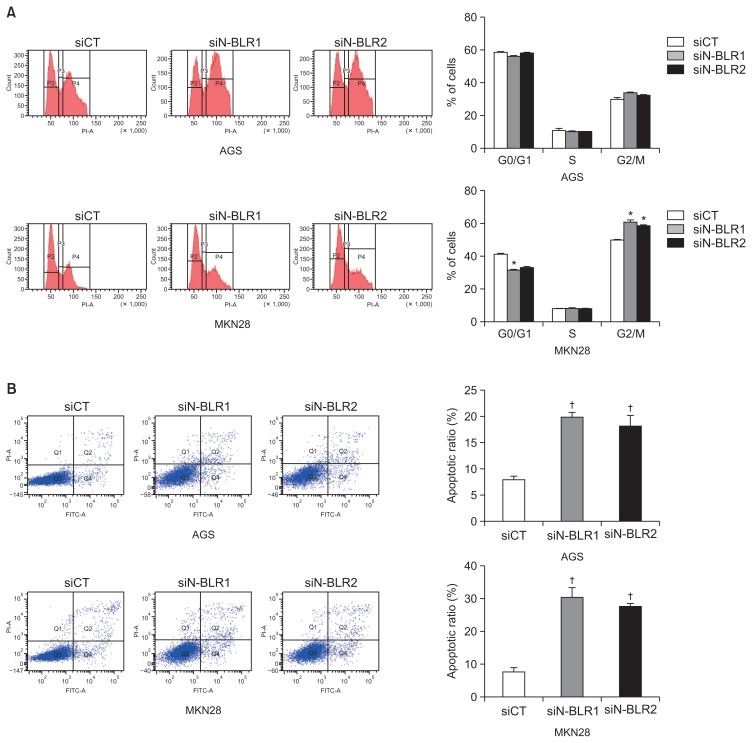
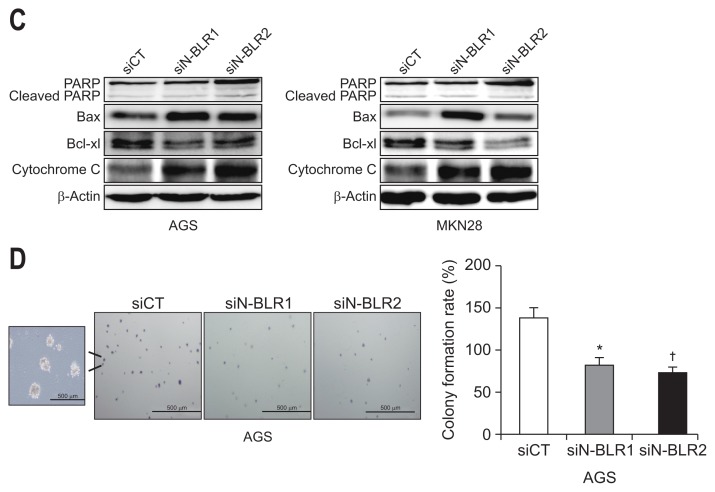
Fig. 4.
N-BLR silencing induced apoptosis and cell cycle arrest. AGS and MKN28 cells were transfected with siCT or siN-BLRs, followed by cell-cycle analysis using propidium iodide (PI) staining (A) and an apoptosis assay using PI/Annexin-V staining (B). (C) Western blotting analysis showed apoptotic and cell cycle markers in transfected AGS and MKN28 cells. (D) Soft agar colony formation was carried out with siN-BLRs stained with 0.5% crystal violet. Scale bar refers to 500 μm. The bar graph reveals the proportion of colony formation. The data represent the mean±SEM. *p<0.05 and †p<0.01 show a statistically significant difference compared with a scrambled control.


