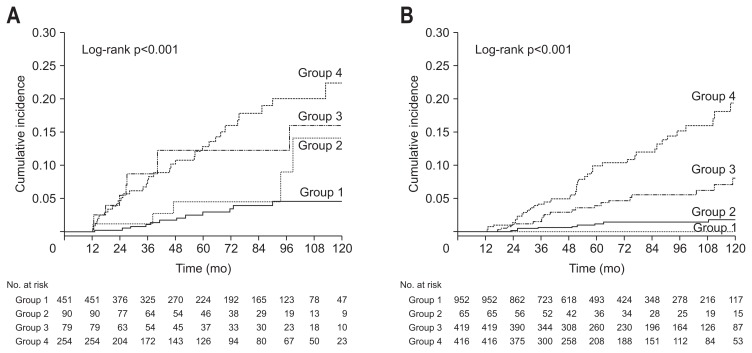
Fig. 4.
Comparison of cumulative diabetes mellitus (DM) risk according to change in nonalcoholic fatty liver disease (NAFLD) status according to body mass index (BMI) change. (A) Kaplan-Meier curves of DM development according to NAFLD status change in subjects with decreased BMI. (B) Kaplan-Meier curves of DM development according to NAFLD status change in subjects with increased BMI. Group 1, subjects who had no NAFLD; group 2, subjects with resolved NAFLD; group 3, subjects with incident NAFLD; and group 4, subjects with persistent NAFLD.

