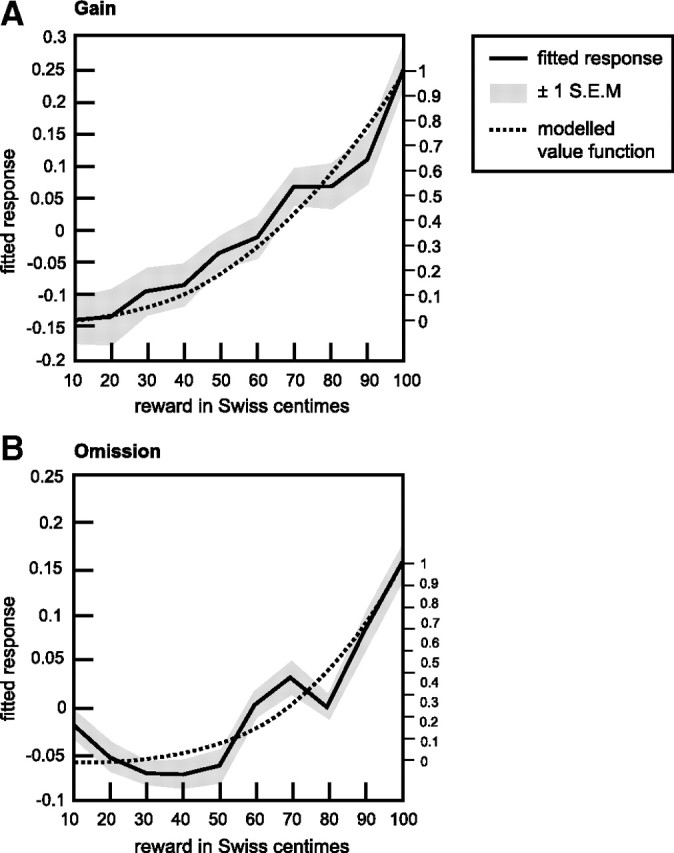
Figure 2.

Electroencephalographically derived value functions. Mean electrophysiological indices of reward (s̄i; for details, see Eq. 3) as function of actual reward for the gain and omission conditions. Solid lines show the average across consistent time frames and subjects and indicate a convex, nonlinear relation between monetary rewards and ERP responses. Gray areas represent ±1 SEM. The dotted lines illustrate the estimated value functions, which corresponded most closely to the exhibited ERP responses and thus explained most variance in the data.
