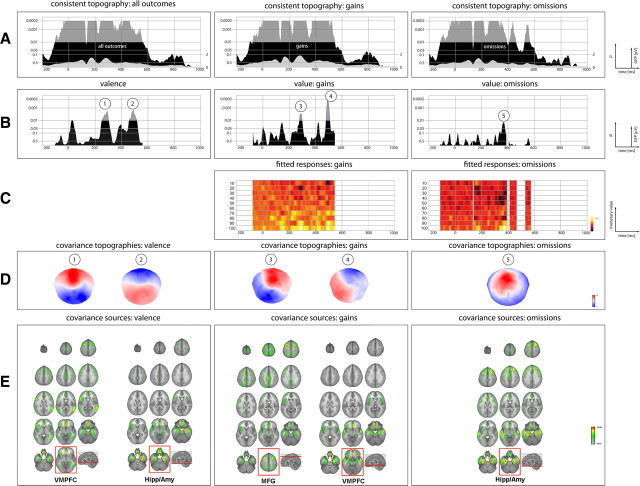
Figure 3.
Overview of ERP: results. A, Results of the topographic consistency test for all outcomes (first row), gains only (second row), and omissions (third row). Black areas indicate the significance level (inversely log-transformed) of the test. Areas exceeding the p < 0.01 mark restrict the time window of the TANCOVA. The gray areas depicted within indicate the GFP. B, Moment-by-moment significance level of the TANCOVA. The height of the area indicates the significance level (inversely log-transformed) of covariation between ERP topographies and valence (first row), value of gains (second row), and value of omissions (third row). C, Plot of the electrophysiological index of reward st,i as function of time and reward level (see Eq. 3). D, Covariance maps of the ERP data of the respective time frames of strong covariance. E, Source estimation of the covariance maps. The loci of maximal CSD (e.g., representing the maximal contribution to the covariance in the ERP topography) are framed in red. It is worth emphasizing that, in all conditions, similar sources differently contribute to the covariance at the level of the ERP topography.

