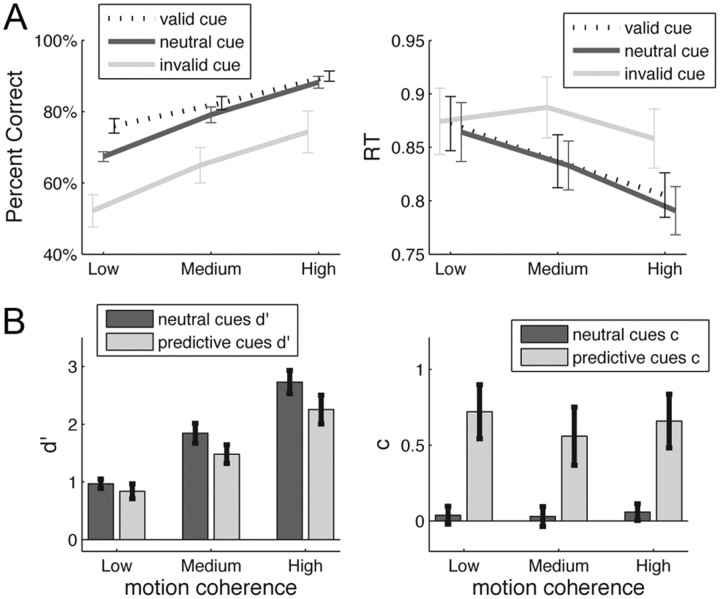
Figure 2.
Behavioral results. A, Accuracy and reaction times are plotted as a function of motion coherence (low, medium, high) and cue type (valid, neutral, invalid). Overall, higher motion coherence led to higher accuracy and lower reaction times. Similarly, invalid cues decreased performance, whereas valid cues improved it. Error bars show the SEM. B, The SDT measures d′ and c were computed independently for predictive (i.e., valid and invalid) and non-predictive (i.e., neutral) cues to gauge subjects' ability to do the task with/without the expectation provided by the cues. Surprisingly, d′ was lower for predictive than for neutral cues. Subjects were unbiased (c ∼0) when doing the task with neutral cues but shifted their criterion toward the expected percept when predictive cues were presented. Error bars show the SEM.

