
Figure 2.
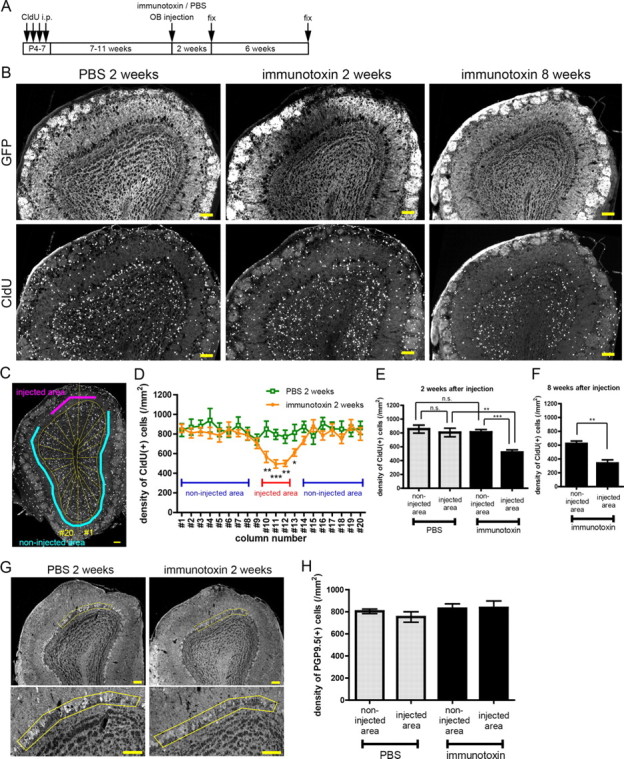
Area and cell-type specificity of immunotoxin-mediated cell ablation. A, Schedule of CldU labeling of preexisting GCs and immunotoxin or PBS injection in the adult OB. The animals received CldU injection intraperitoneally at P4–P7 and immunotoxin or PBS injection in the local OB area at the age of 8–12 weeks. B, Immunoreactivity for GFP (top) and CldU (bottom) of the OB at 2 weeks after PBS injection (left) or immunotoxin injection (middle) and 8 weeks after immunotoxin injection (right). C, Definition of the injected and non-injected areas in a coronal section of the OB. An image of an OB coronal section was divided into 20 columnar subregions. D, Density of CldU-labeled preexisting GCs in each column at 2 weeks after immunotoxin or PBS injection. Density in the corresponding subregions between immunotoxin- and PBS-injected OB was compared. Columns #10–12 showed a significant decrease (p < 0.01) in density in the immunotoxin-injected OB. n = 9 and 10 mice for PBS or immunotoxin injection, respectively. *p < 0.05; **p < 0.01; ***p < 0.001 (unpaired t test). E, F, Density of CldU-labeled preexisting GCs at 2 weeks after immunotoxin or PBS injection (E) and 8 weeks after immunotoxin injection (F) (n = 9, 10 mice, for PBS and immunotoxin, respectively in E; n = 6 mice in F). **p < 0.01; ***p < 0.001; n.s., not significant (one-way ANOVA with post hoc Tukey's test in E, unpaired t test in F). G, Distribution of PGP9.5-expressing mitral cells in the PBS-injected (left) and immunotoxin-injected (right) OB at 2 weeks after injection. MCL of the injected area is delineated by yellow lines. Bottom panels show magnified views of the delineated regions of the top panels. H, Density of PGP9.5-expressing mitral cells in the injected and non-injected area at 2 weeks after local immunotoxin or PBS injection. No significant difference in density was observed among the four groups. n = 4 mice for individual groups (one-way ANOVA). Data in D–F and H show mean ± SEM. Scale bars: B, C, G, 100 μm.