
Figure 3.
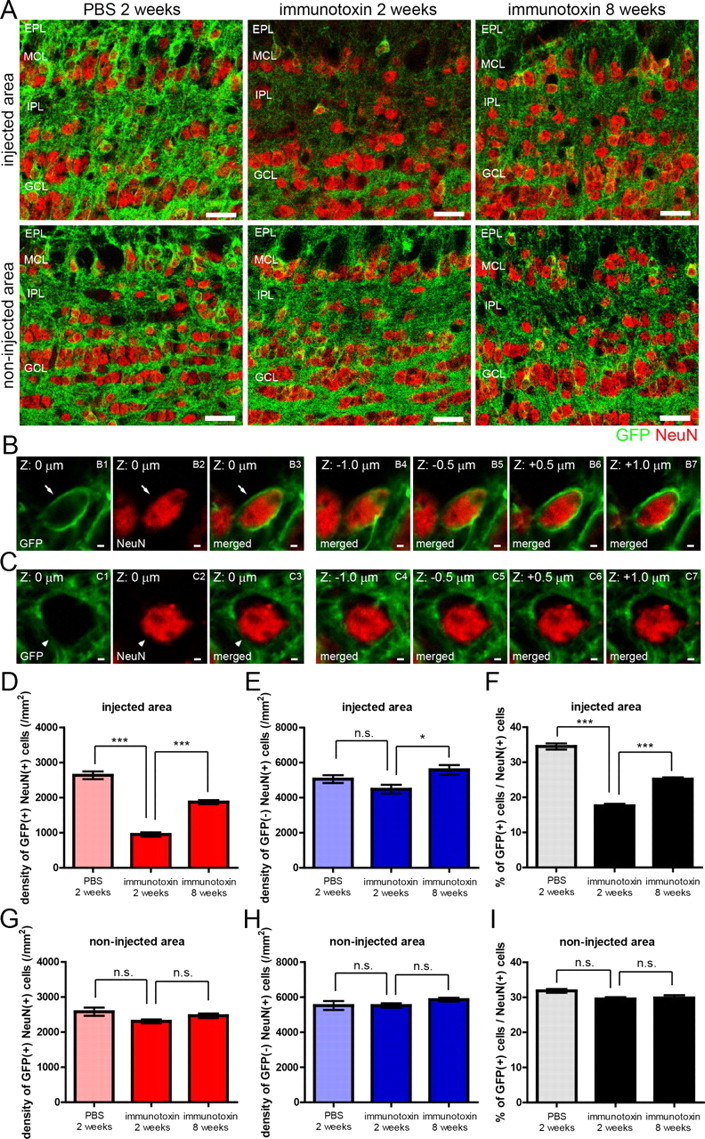
Recovery of mGluR2-expressing GC subset after the ablation of preexisting mGluR2-expressing GCs in a local OB area. A, Confocal images of GFP-positive GCs and GFP-negative GCs in the injected area (top) and non-injected area (bottom) of the OB after immunotoxin or PBS injection. Left, Two weeks after PBS injection; middle, 2 weeks after immunotoxin injection; right, 8 weeks after immunotoxin injection. Green, GFP; red, NeuN. B, C, Confocal images of a GFP-positive NeuN-expressing GC (B) and a GFP-negative NeuN-expressing GC (C). Left three panels show GFP expression (green), NeuN expression (red), and the merged view at a same z-plane (z = 0 μm). Right four panels show the merged views at different z-planes of the same GC (z = −1.0, −0.5, +0.5, and +1.0 μm). D, E, Density of GFP-positive (D) and GFP-negative (E) NeuN-expressing GCs in the injected area at 2 weeks after PBS injection, 2 weeks after immunotoxin injection, and 8 weeks after immunotoxin injection. F, Percentage of GFP-positive GCs among NeuN-expressing GCs in the injected area at 2 weeks after PBS injection, 2 weeks after immunotoxin injection, and 8 weeks after immunotoxin injection. Number of NeuN-expressing cells examined was 319–562 cells per an animal. G, H, Density of GFP-positive (G) and GFP-negative (H) NeuN-expressing GCs in the non-injected area. I, Percentage of GFP-positive GCs among NeuN-expressing GCs in the non-injected area. Number of NeuN-expressing cells examined was 333–535 cells per an animal. n = 4, 5, and 5 mice for 2 weeks after PBS injection, 2 weeks after immunotoxin injection, and 8 weeks after immunotoxin injection, respectively. *p < 0.05; ***p < 0.001; n.s., not significant (one-way ANOVA with post hoc Tukey's test). Data in D–I show mean ± SEM. Scale bars: A, 20 μm; B, C, 5 μm.