
Figure 4.
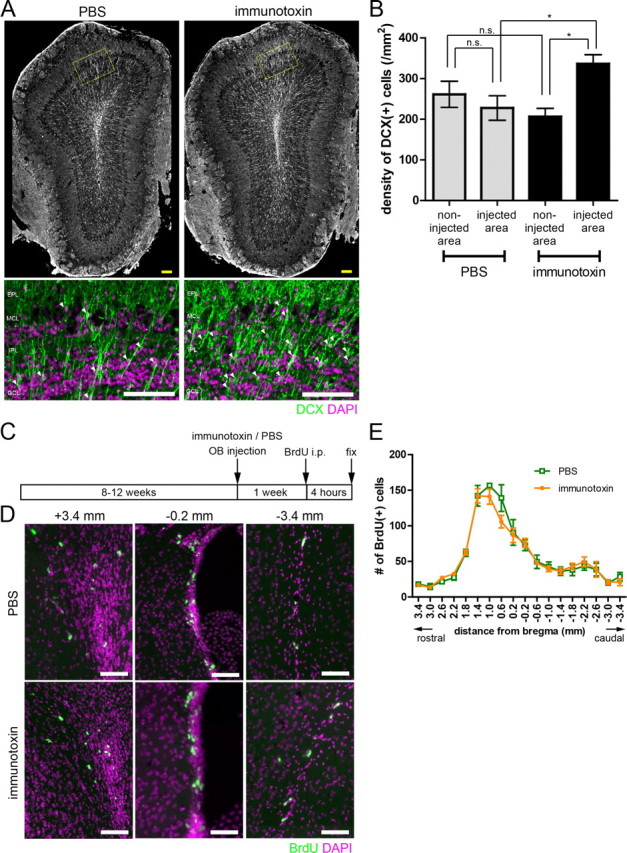
Increased recruitment of immature new neurons to the local OB area of preexisting mGluR2-expressing GC ablation. A, Top panels show distribution of DCX-expressing cells in the PBS-injected (left) or immunotoxin-injected (right) OB at 2 weeks after injection. Bottom panels show magnified views of the delineated regions of the top panels. Green, DCX; magenta, DAPI. Arrowheads indicate somata of DCX-expressing cells. B, Density of DCX-expressing cells in the injected and non-injected OB area at 2 weeks after local immunotoxin or PBS injection. n = 4 and 5 mice for PBS and immunotoxin injection, respectively. *p < 0.05; n.s., not significant (one-way ANOVA with post hoc Tukey's test). C, Schedule for BrdU labeling of proliferating cells in the rostral migratory stream and the SVZ after immunotoxin or PBS injection into the OB. Mice received BrdU injection at 1 week after immunotoxin or PBS injection and fixed at 4 h after BrdU injection. D, BrdU-labeled proliferating cells in the rostral migratory stream (left), rostral SVZ (middle), and caudal SVZ (right). Top panels show PBS-injected animals, and bottom panels show immunotoxin-injected animals. Green, BrdU; magenta, DAPI. E, Number of BrdU-labeled cells in the immunotoxin- or PBS-injected animals. No significant difference in number between immunotoxin- and PBS-injected animals was observed along all the rostrocaudal levels examined (n = 4 mice in each group, unpaired t test). Data in B and E show mean ± SEM. Scale bars: A, 100 μm; D, 50 μm.