
Figure 5.
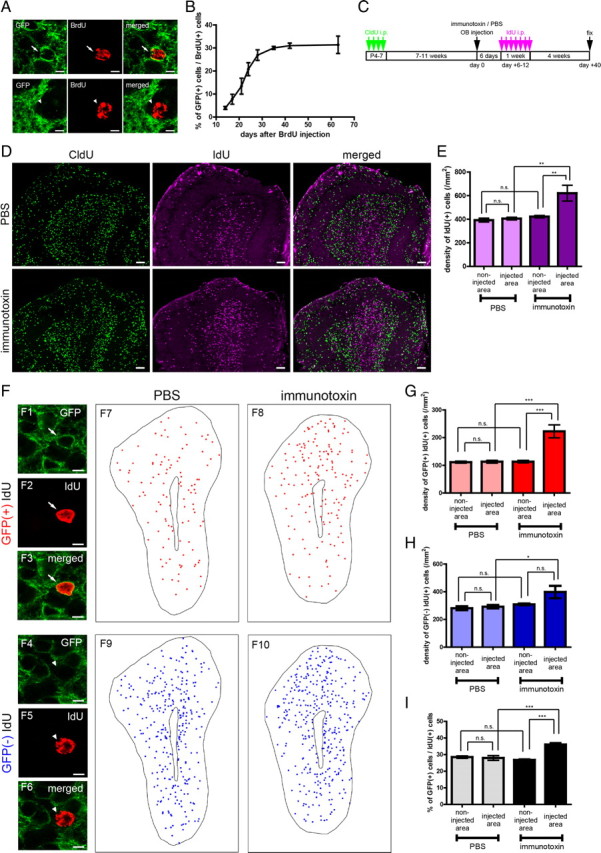
Preferential incorporation of an mGluR2-expressing subset of adult-born GCs in the local area of ablation. A, B, Time course of GFP expression during the maturation of adult-born GCs. A, Confocal images of a GFP-positive (top) and a GFP-negative (bottom) BrdU-labeled new GC at 28 d after BrdU labeling. B, Percentage of GFP-positive cells among BrdU-labeled new GCs at 14, 17, 21, 24, 28, 35, 42, and 63 d after BrdU administration in the intact adult transgenic mice. Number of BrdU-labeled cells examined was 80–243 cells per an animal. n = 3 mice at each time point. C, Schedule of CldU labeling of preexisting GCs, immunotoxin, or PBS injection, IdU labeling of adult-born new GCs, and fixation. D, Distribution of CldU-labeled preexisting GCs (left, green), IdU-labeled new GCs (middle, magenta), and the merged views (right) in OB that received PBS (top) or immunotoxin (bottom) injection. E, Density of IdU-labeled GCs in the injected and non-injected area of OBs that received local immunotoxin or PBS injection. n = 5 mice in each group. **p < 0.01; n.s., not significant (one-way ANOVA with post hoc Tukey's test). F, Distribution of mGluR2-expressing and -negative IdU-labeled new GCs. F1–F6, Confocal images of a GFP-positive IdU-labeled new GC (F1–F3) and a GFP-negative IdU-labeled new GC (F4–F6). F7–F10, Distribution of GFP-positive IdU-labeled GCs (red, F7, F8) and GFP-negative IdU-labeled GCs (blue, F9, F10) in the PBS-injected (F7, F9) or immunotoxin-injected (F8, F10) OBs. The MCL and core are outlined. G, H, Density of GFP-positive (G) and GFP-negative (H) IdU-labeled new GCs in the injected and non-injected area of OBs that received local immunotoxin or PBS injection. I, Percentage of GFP-positive GCs among IdU-labeled GCs in the injected and non-injected area. Number of IdU-labeled cells examined per an animal were 234–296, 70–93, 273–362, and 92–169 cells in the four groups, respectively (columns from left to right). n = 5 mice in each group for G–I. *p < 0.05; ***p < 0.001; n.s., not significant (one-way ANOVA with post hoc Tukey's test). Data in B show mean ± SD. Data in E and G–I show mean ± SEM. Scale bars: A, F1–F6, 5 μm; D, 100 μm.