
Figure 4.
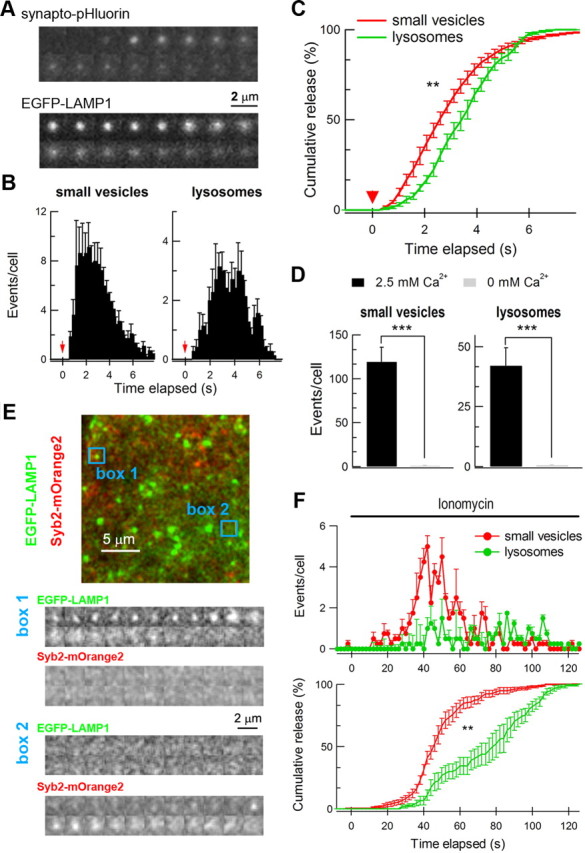
Small vesicles and lysosomes both underwent Ca2+-dependent exocytosis, as revealed by TIRFM. A, Representative events of small vesicle and lysosome fusion observed with synapto-pHluorin and EGFP-LAMP1. Each frame is 220 ms and the image size is 2.2 μm × 2.2 μm. Scale bar, 2 μm. B, Histograms of small vesicle and lysosome fusion events following mechanical simulation observed by TIRFM. Cultured astrocytes were transiently transfected with synapto-pHluorin or EGFP-LAMP1 to label small vesicles or lysosomes. Each column indicates the number of fusion events in each imaging frame. The red arrow marks the time when mechanical stimulation was applied. The bars depict mean ± SEM. C, Cumulative fusion plots (normalized) of small vesicles and lysosomes in single-color TIRFM. Red arrowhead marks the mechanical stimulation. The latencies between stimulation and 50% of total exocytosis were significantly different for small vesicles and lysosomes. **p < 0.01; Student's t test. D, Summary of evoked exocytosis of small vesicles and lysosomes in the presence or absence of 2.5 mm Ca2+. Total events within 30 frames (7.8 s) after mechanical stimulation were analyzed. ***p < 0.001; Student's t test. Data in B–D were from 9 cells for small vesicles and 10 cells for lysosomes. E, Representative image of dual-color TIRFM of small vesicle and lysosome fusion in a cultured astrocyte. The astrocyte was transiently transfected with Syb2-mOrange2 and EGFP-LAMP1. Ionomycin (2.5 μm) was applied in the bath to trigger vesicle fusion. Two representative fusion events are shown. In box 1, a lysosomal vesicle was exocytosed in the absence of small vesicle fusion. In box 2, only a small vesicle fusion was observed. Scale bars, 5 μm and 2 μm. F, Top graph shows summary plots of small vesicle (red) and lysosome (green) fusion in dual-color TIRFM. Bottom graph shows normalized cumulative events of small vesicle and lysosome fusion. Each point represents the number of fusion events of normalized results in 2 s averaged from 10 cells. The bars depict mean ± SEM. The latencies between stimulation and 50% of total exocytosis were significantly different for small vesicles and lysosomes. **p < 0.01; Student's t test.