
Figure 8.
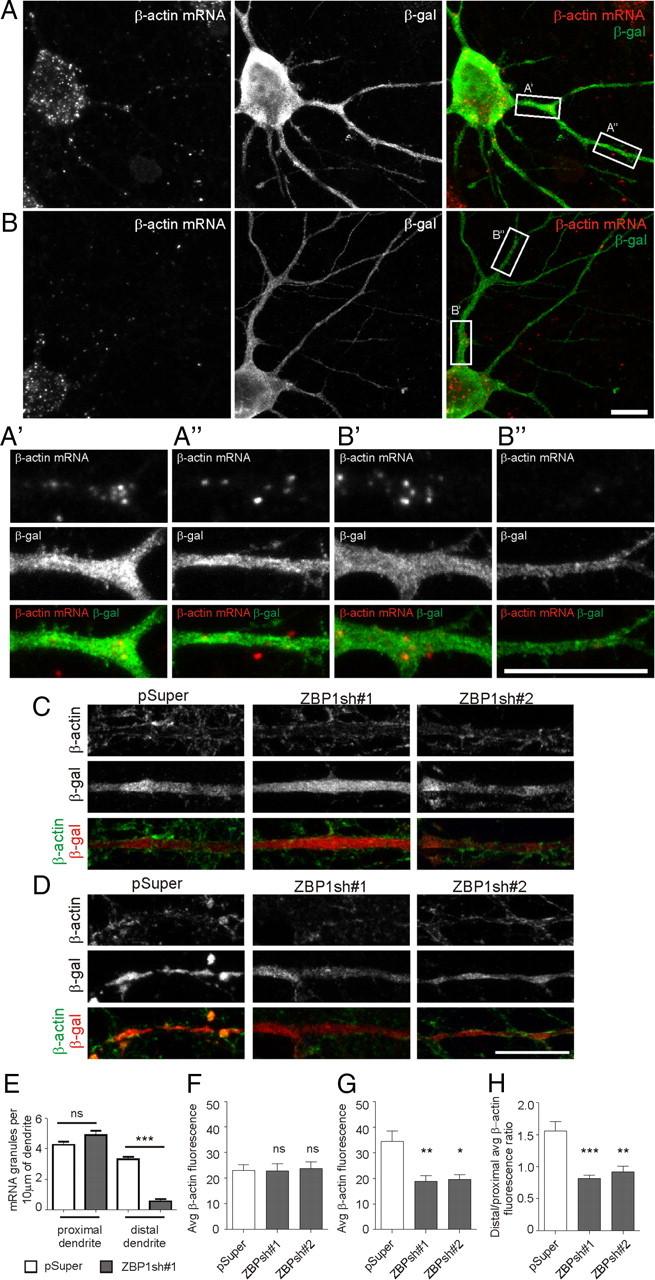
β-Actin mRNA and protein localization are disturbed in ZBP1-knockdown neurons. A, B, Representative micrographs of fluorescent β-actin in situ hybridization (red) in hippocampal neurons that were transfected on DIV7 with pSuper (A) or ZBP1sh#1 (B) for 36 h. Neuronal morphology is visualized by staining for cotransfected β-gal (green). Scale bar, 10 μm. A′, A″, B′, and B″ show in greater magnification fragments of proximal (A′, B′) and distal (A″, B″) dendrites of transfected neurons. Scale bar, 10 μm. C, D, Hippocampal neurons were transfected at DIV7 for 48 h with pSuper, ZBP1sh#1, or ZBP1sh#2. Pictures show β-actin staining in proximal (C) and distal (D) dendrites of transfected cells. Scale bar, 10 μm. E, Mean number of β-actin mRNA granules per 10 μm of dendrite measured in proximal and distal dendrites (after branching). ***p < 0.001; ns, not significant; unpaired t test with Welch's correction. F–H, Average intensity of fluorescence of β-actin protein in proximal (F) and distal (G) dendrites, and ratio of average fluorescence intensities in distal and proximal dendrites (H). ***p < 0.001; **p < 0.01; *p < 0.05; ns, not significant; Kruskal–Wallis test followed by Mann–Whitney post hoc test with Bonferroni's adjustment. Error bars indicate SEM.