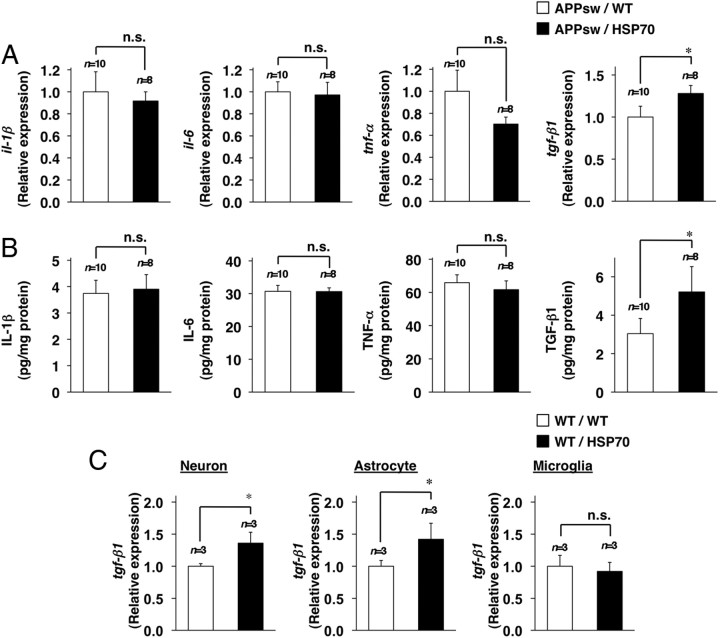
Figure 7.
Effects of HSP70 overexpression on cytokine expression. A, B, Total RNA (A) or whole-cell extracts (B) were prepared from the brains of 12-month-old APPsw/WT (n = 10) and APPsw/HSP70 mice (n = 8). C, Total RNA was also extracted from primary culture of neurons, astrocytes, and microglia prepared from WT/WT (n = 3) and WT/HSP70 mice (n = 3). RNA samples were subjected to real-time RT-PCR as described in the legend of Figure 6 (A, C). The amounts of cytokine in the whole-cell extracts were determined by ELISA (B). Values are given as mean ± SEM (A, B) or SD (C). *p < 0.05. n.s., Not significant.

