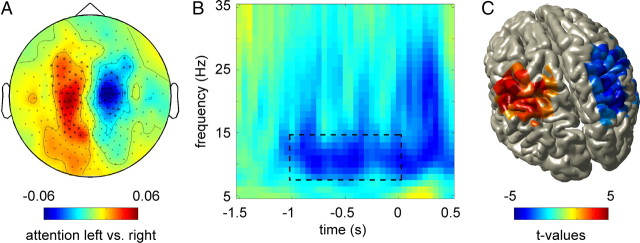
Figure 2.
Prestimulus somatosensory alpha lateralization. A, Topographic plot showing prestimulus (t = −1 to 0 s) alpha power (8–14 Hz) lateralization in sensors over sensorimotor regions. Sensors showing significant modulation (p < 0.05) are marked with asterisks. B, Average TFR of the sensors identified in A, showing sustained decrease of alpha activity during the prestimulus interval (t = −1 to 0 s). Left-hemispheric sensors were mirrored to combine them with the right-hemispheric sensors (scale as in A). C, Alpha power source reconstructions obtained using beamforming are shown on a standardized brain volume. Lateralized alpha activity is located in sensorimotor cortex (including Brodmann areas 1, 2, 3). The color code represents t values obtained from the comparison between attention to left and right hand. The t values are masked at a p value of <0.1, indicating a significant effect for the right somatosensory source (p < 0.01) and a trend for the left source (p = 0.062). All plots are showing power as a contrast between attention left and attention right in the 100% condition, grand-averaged over 18 subjects (note: 17 subjects were included in the source reconstruction).

