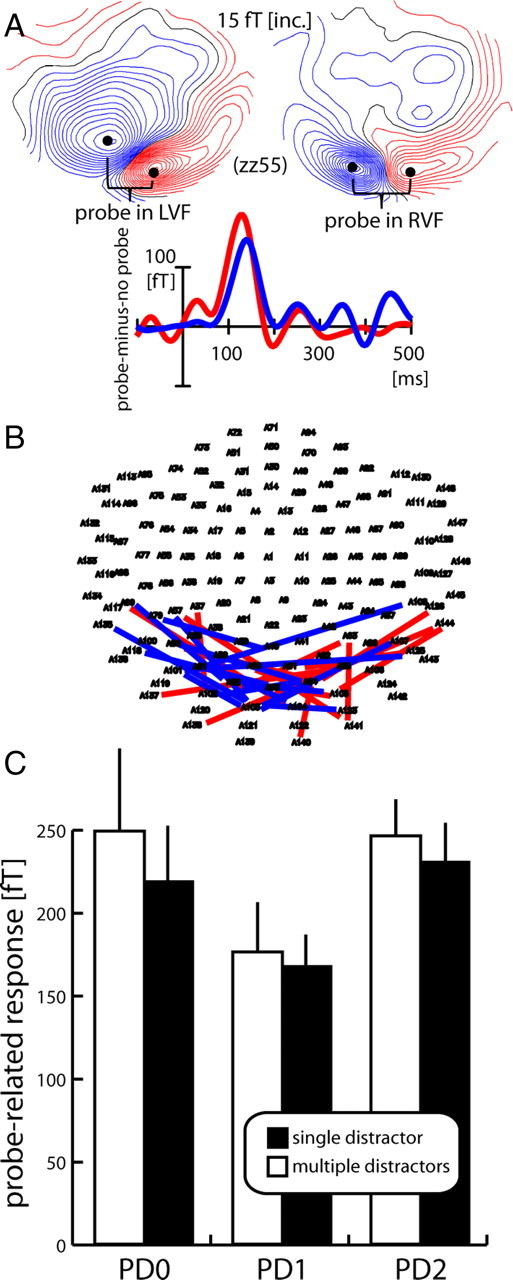
Figure 2.

Probe response and surround-attenuation effect (experiment 1). A, Mean ERMF response to the probe (FP-minus-FO difference, average over all probe-distance conditions) in one representative subject (zz55). The maps show the ERMF distribution at 130 ms after probe onset in the left (left map) and right VF (right map) visible as efflux–influx configurations over central occipital regions, with red lines representing the efflux and blue lines the influx component of the field; the waveforms represent the response to left VF (red trace) and right VF probes (blue trace) collapsed over measurements from sensors (black dots) showing efflux and influx maxima (efflux-minus-influx difference). B, Localization of individual maxima of efflux–influx configurations in each subject for probes in the left (red lines) and right (blue lines) VF. Each line connects sensors showing efflux and influx maxima of a given subject. C, Grand average (over subjects and VF of probe presentation) probe-related response (FP-minus-FO difference) as a function of distance to the focus of attention for the single- (black) and multiple- (white) distractor conditions. Error bars show the SEM.
