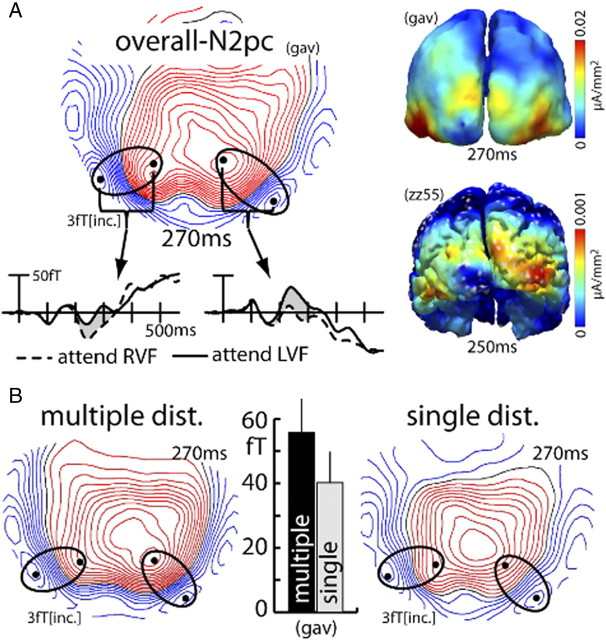
Figure 4.
N2pc effect (experiment 1). A, Waveforms, ERMF distribution, and current source density estimates of the overall N2pc [grand average (gav) over subjects; collapsed over distractor conditions; FO-trials only]. The waveforms show the response recorded at sensor sites (black dots) positioned over maxima of the efflux–influx configurations. The response was collapsed over measurements from sensors (black dots) representing corresponding efflux and influx maxima (efflux-minus-influx difference). The N2pc effect is visible as the difference between waveforms (gray area) elicited by targets in the left (solid traces) and right (dashed traces) VF between ∼200 and 330 ms after search frame onset. The activation maps on the right show the current source density distribution of the N2pc of the grand average (top) and of a single representative subject (zz55, bottom). B, Field distribution of the multiple- (top) and single- (bottom) distractor conditions of the grand average N2pc at 270 ms. The bar graph shows the amplitude of the grand average (gav) N2pc response separately for the two distractor conditions (collapsed over left and right hemisphere responses).

