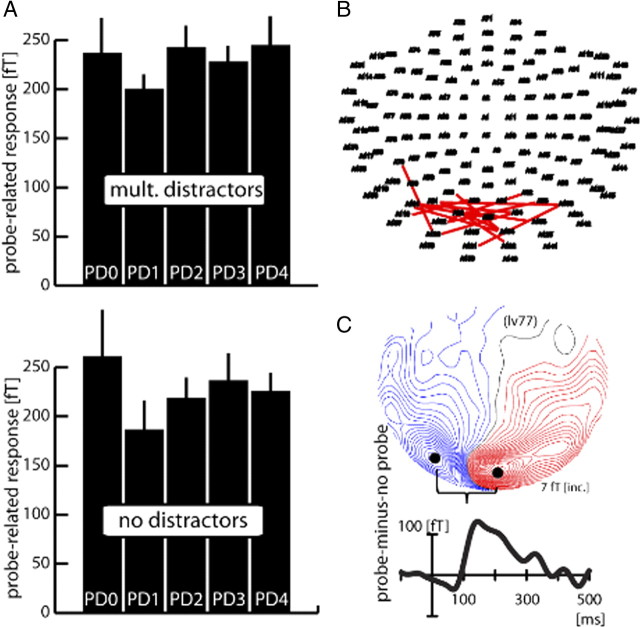
Figure 6.
Probe response and surround-attenuation effect (experiment 2). A, Average probe response (over subjects) as a function of distance to the focus of attention (PD0–PD4) for the multiple-distractor (top) and the no-distractor (bottom) conditions. The bar graphs represent the average ERMF response between 120 and 140 ms after probe onset. Equivalent probe distances toward the horizontal and vertical meridian were collapsed. Before averaging over subjects, the size of the probe-related response was determined in each subject by measuring the amplitude difference between the individual efflux and influx maxima representing the probe-related response. B, Localization of efflux–influx maxima of each subject (n = 14) participating in experiment 2. Each red line connects the efflux and influx maximum of the probe-related response of one subject. C, Probe-related ERMF response (FP-minus-FO difference averaged over all probe-distance conditions) of a single representative subject (lv77).

