
Figure 7.
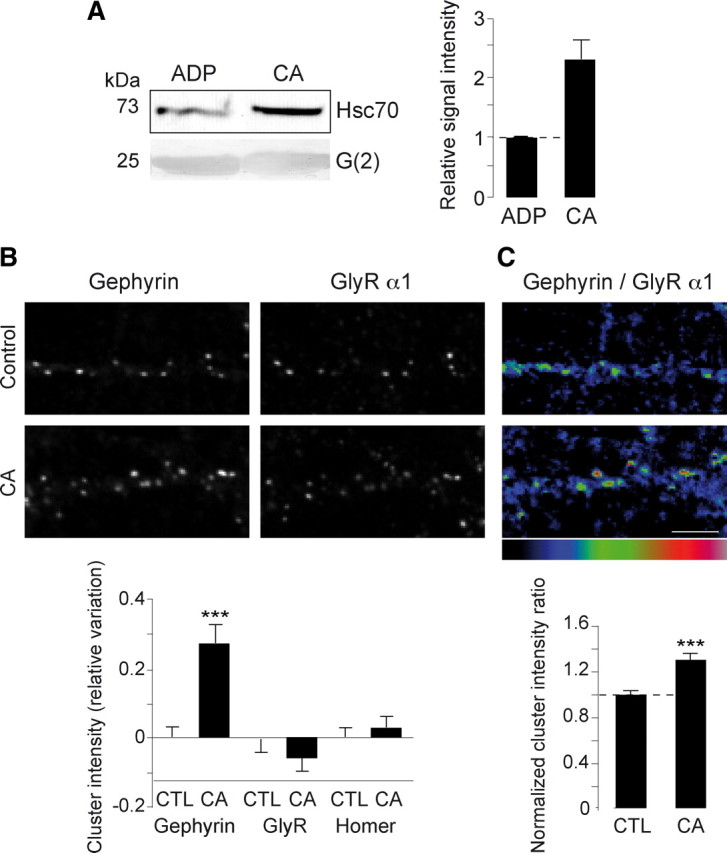
Hsc70 inhibition induces gephyrin clustering at synapses. A, CA caused an increase in gephyrin-Hsc70 interaction. The G(2)-domain of gephyrin was incubated with purified Hsc70 in the presence of ADP or CA. Pulled-down Hsc70 was visualized after Western blotting (left). Band intensities were quantified and expressed relative to the signal intensity of the ADP treatment (means ± SEM, four independent experiments) (right). The interaction of the G-domain of gephyrin with Hsc70 was potentiated in the presence of CA. B, C, Spinal cord neurons derived from homozygous gephyrin-mRFP knock-in mouse at 10 DIV were treated with 2 mm CA for 48 h, and live-stained for the GlyR α1-subunit. Scale bar, 5 μm. B, Normalized variation of integrated fluorescence intensities (means ± SEM) of gephyrin, GlyR and Homer clusters (as shown on top) after CA treatment. Cluster measurements were normalized by the averaged cluster measurements obtained in control conditions. Note that the gephyrin cluster intensity significantly increased with CA (***p < 10−3, two-way ANOVA, three independent experiments), while that of GlyR α1 and of Homer did not change (bottom). C, Ratio of gephyrin to GlyR α1 integrated fluorescence intensity done cluster by cluster was increased in the presence of CA (means ± SEM, ***p < 10−3, two-way ANOVA, three independent experiments).