
Figure 3.
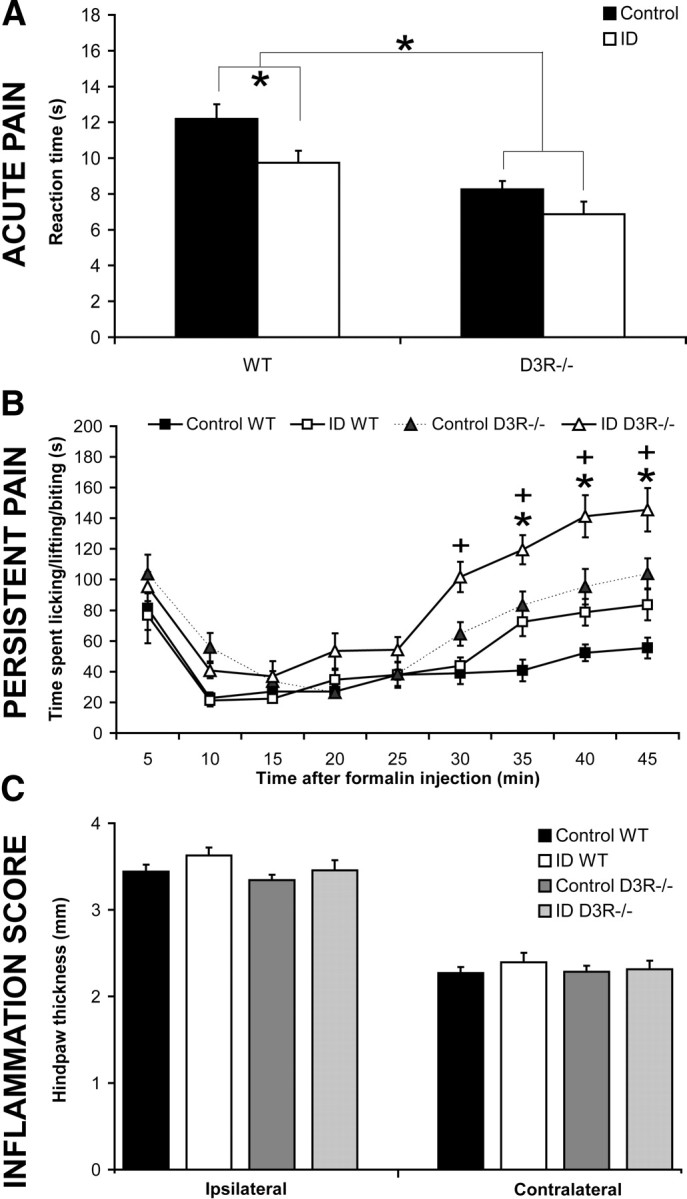
Response differences to acute and persistent pain. A, The acute pain response scores (in seconds) until the initial hindpaw licking or escape were recorded by the hot-plate test. Values are means ± SEM, n = 7. *WT and D3R−/− groups differ at a diet duration of 15 weeks beginning at age P28. B, The persistent pain response to the formalin injection over time (in minutes) in WT and D3R−/− mice fed control or ID diets for 15 weeks starting from age P28. Values are means ± SEM, n = 7. *WT and +D3R−/− groups differ at certain time points, p < 0.05. C, After the formalin injection, the injected (ipsilateral) and noninjected (contralateral) hindpaw thicknesses were measured (in millimeters), and the value denoted the level of inflammation. Values are means ± SEM, n = 7.