Figure 3.
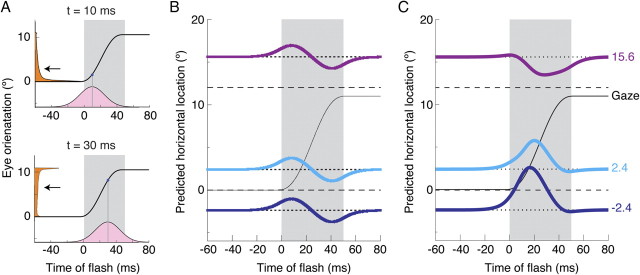
A simple model that can account for the mislocalization pattern. A, Combining a normally distributed temporal uncertainty (illustrated in pink for two moments of the flash; σt = 15 ms; top, μt = 10 ms; bottom, μt = 30 ms) with the eye orientation, gives the likely distribution of eye orientations shown on the left (orange). Note that the mean values of the orientations (arrows at 2.9° and 6.6°) do not correspond with the orientations of the eye (blue dots at 1.1° and 7.5°). B, Combining these orientation distributions with the retinal stimulation gives likely distributions for the position of the flashed object in space for each moment of time. The means of the distributions for the three locations (curved lines) look similar to the mislocalization curves that are found when one performs these kinds of experiments in the dark. C, The mislocalization curves are different if the distribution for the position of the flashed object in space is combined with a foveal bias (σs = 5°), centered where an efferent eye signal that precedes the actual eye movement by 20 ms indicates that the eye is looking. Note the resemblance with Figure 1C.

