
Figure 7.
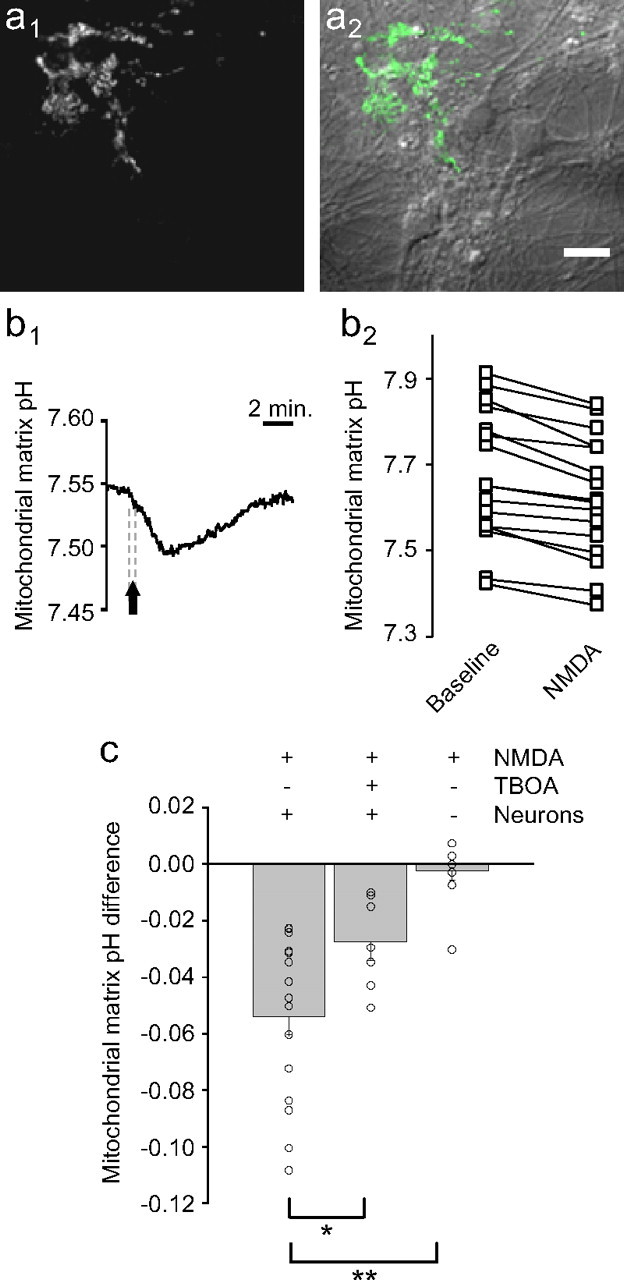
Neuronal release of glutamate triggers glutamate transporter-mediated mitochondrial matrix acidification in astrocytes. Images depicting fluorescent MitoSypHer expression in astrocytes (a1) surrounding neurons visible under DIC (a2). Scale bar, 20 μm. b1, MitoSypHer fluorescence excitation ratio monitored in astrocytes during a 20 s stimulation of neurons using NMDA (10 μm). Representative trace (b1) and individual data (b2) of mitochondrial matrix pH of astrocytes at baseline and after NMDA stimulation. c, Amplitudes of NMDA-evoked astrocyte mitochondrial matrix acidification in the absence or presence of TBOA and neurons. NMDA (n = 9, 16 cells); NMDA + TBOA (n = 5, 7 cells); NMDA without neurons (n = 4, 11 cells). * p < 0.05 and ** p < 0.01 using unpaired Student's t test.