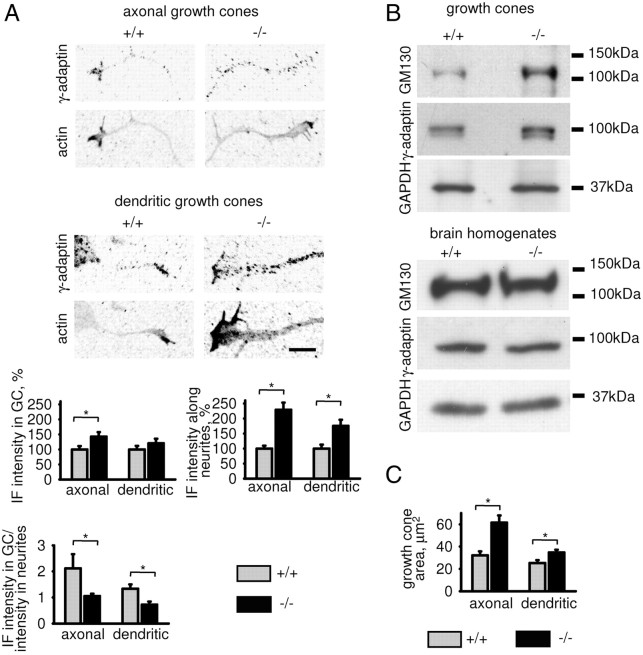
Figure 1.
Distribution of the TGN-derived organelles is abnormal in NCAM−/− neurites. A, Axons and dendrites of cultured NCAM+/+ and NCAM−/− hippocampal neurons labeled with antibodies against γ-adaptin (TGN marker) and actin. Immunofluorescence signals are shown as grayscale inverted images to better visualize the distribution of TGN-derived organelles observed as accumulations of γ-adaptin. Note that numbers of γ-adaptin-positive organelles are increased in NCAM−/− neurites, but their predominant accumulation in growth cones is impaired. Graphs show intensity of γ-adaptin immunofluorescence (IF) along neurites and in growth cones (GC), and ratio of the γ-adaptin immunofluorescence intensity in growth cones to neurites (mean + SEM, n = 100 neurons from a representative experiment; immunofluorescence intensity values were normalized to the mean value in NCAM+/+ neurons set to 100%; the same effect was observed in 3 independent experiments). Levels of actin used to visualize growth cones were not different in growth cones of both genotypes (not shown). Note that in NCAM+/+ neurites, the ratio of the γ-adaptin immunofluorescence intensity in growth cones to neurites is >1, indicating predominant accumulation of TGN-derived organelles in growth cones versus neurites. This ratio is <1 in NCAM−/− neurites. *p < 0.05 (t test). Scale bar, 10 μm. B, NCAM+/+ and NCAM−/− growth cones and brain homogenates probed by Western blot with antibodies against GM130 and γ-adaptin. GAPDH served as loading control. Note that levels of GM130 and γ-adaptin are similar in NCAM+/+ and NCAM−/− brain homogenates and increased in NCAM−/− versus NCAM+/+ growth cones. C, Graph shows mean + SEM apparent boundary area of growth cones in A. Note that the apparent boundary area in NCAM−/− versus NCAM+/+ growth cones is increased. *p < 0.05 (t test).

