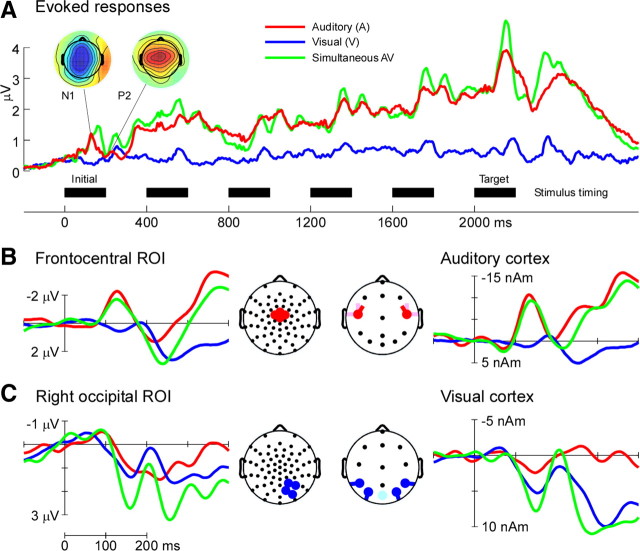
Figure 3.
Summary of evoked responses in auditory, visual, and simultaneous audiovisual trials. A, Grand average evoked responses across auditory (red), visual (blue), and simultaneous audiovisual (green) trials, shown as global field power, the spatial SD of responses across all sensors. Scalp voltage maps are shown for auditory evoked N1 and P2 peaks. Black bars across the bottom represent the timing and duration of each stimulus. Each trial consists of a total of six stimuli. B, Left, Grand average ERPs for the initial stimulus in each trial averaged across sensors in a frontocentral region of interest. Right, Grand average auditory cortex waveform for the same stimuli. Head plots indicate the sensors (left) and the source orientations (right) used. Color codes as A. C, Left, Grand average ERPs for the same stimuli as B averaged across sensors in a right occipital region of interest. Right, Grand average visual cortex waveform for the same stimuli. Head plots as B. Color codes as B. For illustrative purposes, ERPs shown in B and C are low-pass filtered at 40 Hz. ROI, Region of interest.

