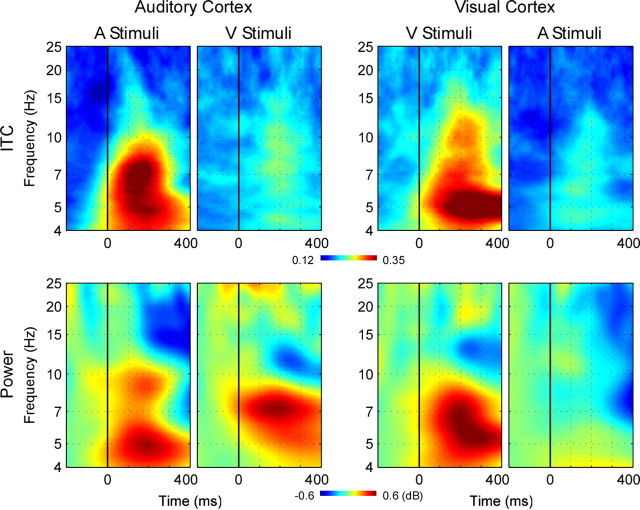
Figure 4.
Time–frequency plots for unisensory responses in auditory and visual cortex. Left, ITC (top) and total power (bottom) in auditory cortex related to the initial stimulus in unisensory auditory (far left) and visual (middle left) trials. Right, as left, showing responses in visual cortex to the same stimuli.

