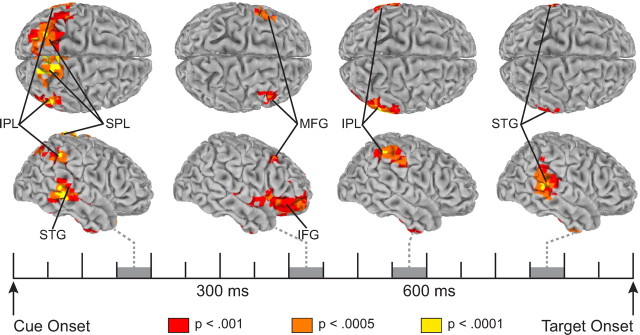
Figure 2.
Spatiotemporal pattern of theta-band (4–7 Hz) activity associated with top-down attention control. Shown are surface-rendered maps of statistically significant increases in activity for shift cues relative to the no-shift cue during four 50 ms time windows. Activity for shift-left and shift-right cues was collapsed such that the left hemisphere displays activity ipsilateral to the cued location and the right hemisphere displays activity contralateral to the cued location. MFG, middle frontal gyrus.

