Figure 1.
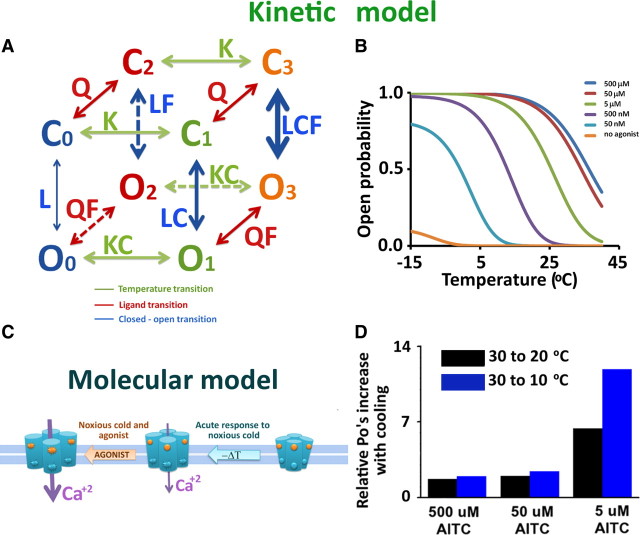
Kinetic and molecular models of TRPA1 channels. A, Allosteric model used to explain the TRPA1 activation by agonists and thermal stimulus. Note that when both stimuli are present, the equilibrium constant between closed and open state (L) becomes CF times larger, enhancing the channel activation. Nevertheless, the channel could visit the open states when all sensors are relaxed, typical behavior of an allosteric model. B, Curves of probability versus temperature at different agonist concentrations using the kinetic model in A. An increase of agonist concentration shifts to higher temperatures the T1/2 value (obtained from Boltzmann equation fits), increasing the open probability of the channel, characteristic of the cold hypersensitivity process. At saturating agonist concentration, the channels become insensitive to cold, because they reach their maximum open probability, previously obtained by del Camino et al. (2010). Their work showed a minimum for TRPA1 channels activation in agonist's absence. This model fully supports the del Camino et al. (2010) findings. C, Activation mechanism of TRPA1 channel. The binding sites for agonists (orange balls) and the thermal sensors (blue balls) are located in different regions of the protein. They are coupling independently with the opening of the pore. When the extreme cold activates just the thermochannel sensors but their agonist binding sites still are empty, the Ca2+ influx is poor and thus the cold fiber detection is also poor and inadequate to generate action potentials. However, when both stimuli are present (the sensors are activated and the agonists have been binding with the channel), a massive entry of Ca2+ concentration produces a high level of membrane depolarization to result in TRPA1 channels with a dual role of detection in the nociceptive fibers involved with cold hypersensitivity. D, Relative increase of Po in response to temperature decrease from 30 to 10–20°C at different agonist concentrations. This graphic was generated by our proposed model. It is almost an exact reproduction of Figure 3C from del Camino et al. (2010). Here, del Camino et al. (2010) showed this relationship for the total relative current.

