
Figure 8.
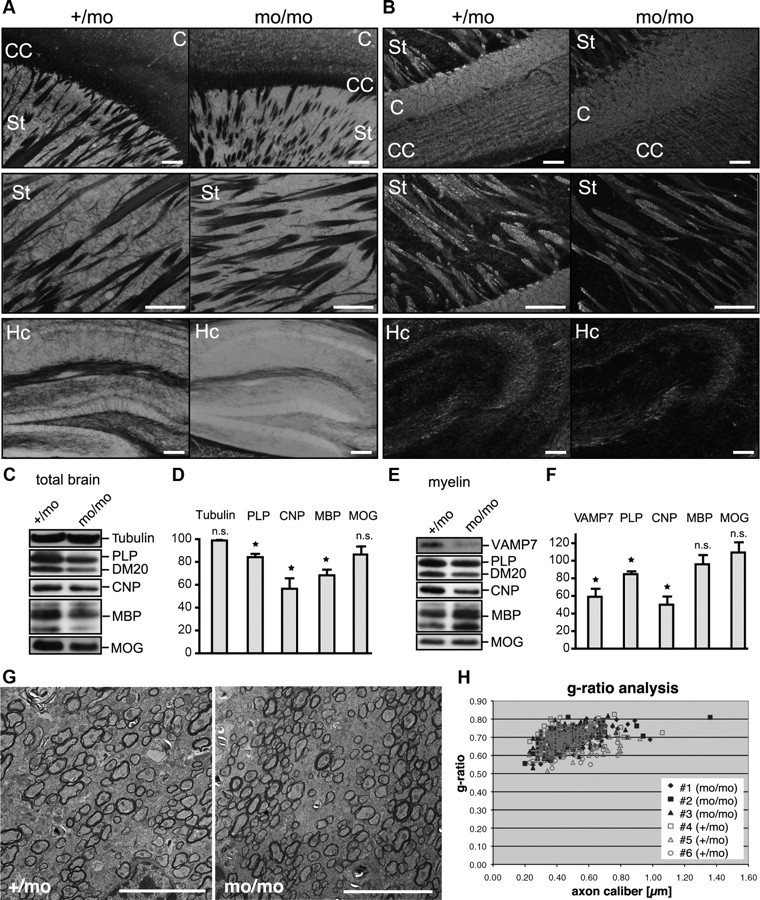
Analysis of myelination in AP-3δ-deficient mocha mice. A, B, Gallyas staining (A) and immunohistochemical staining (B) of PLP of white matter tracts in brains of P30 mocha (mo/mo) and heterozygous (+/mo) littermate control mice. C, Cortex; CC, corpus callosum; St, striatum; Cb, cerebellum; Hc, hippocampus. Scale bars, 100 μm. C, D, Western blot analysis of myelin proteins in brain homogenates from P30 mocha and heterozygous littermate control mice normalized to total protein. Tubulin is shown as loading control. D, Densitometric quantification of Western blots depicting relative levels of myelin proteins in mocha brains normalized to heterozygous littermates (n = 3; SEM; paired t test, *p < 0.05). E, F, Western blot analysis of isolated myelin from P30 mocha and heterozygous littermate control mice normalized to total myelin protein. F, Densitometric quantification of Western blots showing relative levels of proteins in mocha myelin normalized to heterozygous littermates (n = 3; SEM; paired t test, *p < 0.05). G, Electron micrographs taken from the region of the corpus callosum of mocha mice (mo/mo) and heterozygous littermates (+/mo). Scale bar, 5 μm. H, g ratio analysis of myelin sheath thickness in relation to axon diameter in mocha mice.