Figure 5.

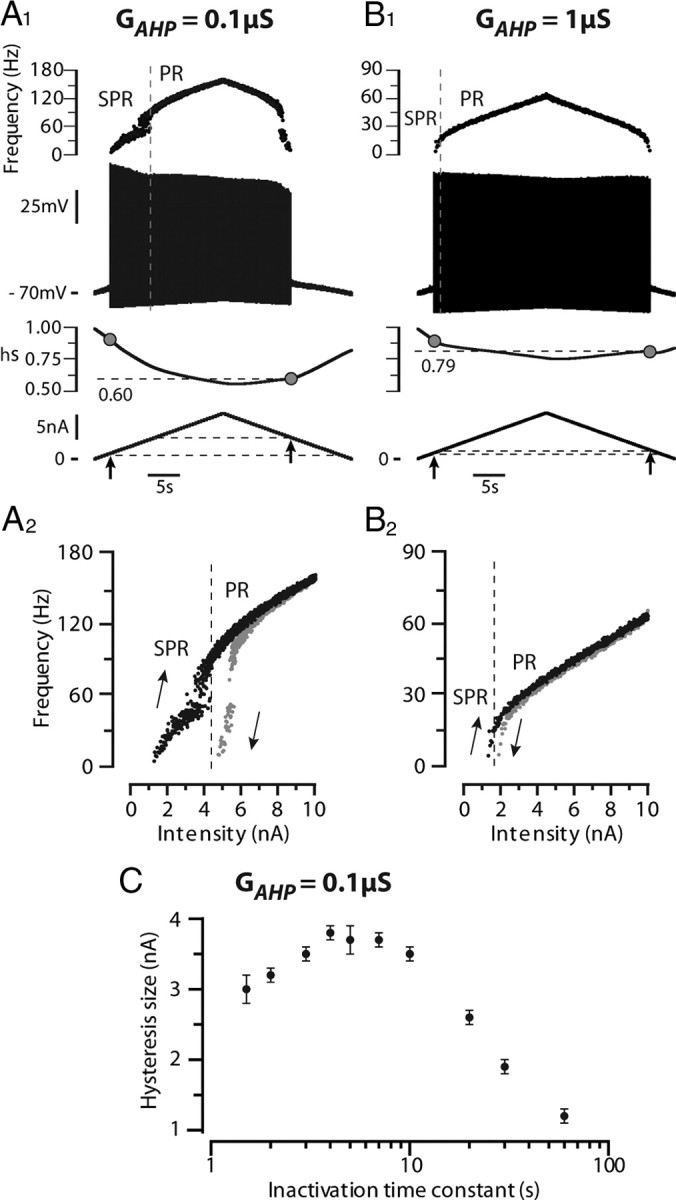
Adding a slow sodium current inactivation to the model creates a clockwise hysteresis. The transient sodium current was endowed with a slow inactivation process (3 s time constant) that added to the fast inactivation (1 ms) already present. The subsequent reduction in excitability was compensated by introducing a persistent sodium current (conductance 2.5 μS) with similar slow inactivaction. A1, Response to a slow triangular ramp of current (0.5 nA/s, amplitude 10 nA) when the AHP conductance was set to 0.1 μS. From top to bottom: instantaneous firing frequency, voltage response, slow inactivation variable (hs, see Materials and Methods) and injected current. Note the reduction of the spike amplitude during the ascending ramp. The gray dots on the inactivation curve point to the inactivation at firing recruitment on the ascending ramp and derecruitment on the descending ramp. PR, Primary firing range; SPR, subprimary firing range. A2, I–F curve. Note the large clockwise hysteresis of the I–F relationship. B1, B2, Response when the AHP conductance was increased 10 times (to 1 μS). Same arrangement as in A1 and A2. Note that the spike amplitude decreases much less, there is less slow inactivation, the subprimary range is narrower, and the hysteresis has almost vanished. C, Size of the hysteresis (i.e., difference between derecruitment and recruitment currents) plotted against the time constant of slow inactivation of the sodium current. The AHP conductance was 0.1 μS. Each point is the average of five simulations, and the vertical bar on each point is the SD. The abscissa is in logarithmic scale.
